

STATISTICS
c2drS
c2drS
- No tags were found...

Create successful ePaper yourself
Turn your PDF publications into a flip-book with our unique Google optimized e-Paper software.
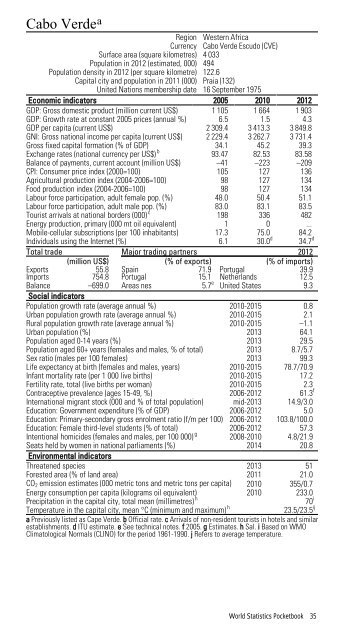
Cabo Verde a Region Western AfricaCurrency Cabo Verde Escudo (CVE)Surface area (square kilometres) 4 033Population in 2012 (estimated, 000) 494Population density in 2012 (per square kilometre) 122.6Capital city and population in 2011 (000) Praia (132)United Nations membership date 16 September 1975Economic indicators 2005 2010 2012GDP: Gross domestic product (million current US$) 1 105 1 664 1 903GDP: Growth rate at constant 2005 prices (annual %) 6.5 1.5 4.3GDP per capita (current US$) 2 309.4 3 413.3 3 849.8GNI: Gross national income per capita (current US$) 2 229.4 3 262.7 3 731.4Gross fixed capital formation (% of GDP) 34.1 45.2 39.3Exchange rates (national currency per US$) b 93.47 82.53 83.58Balance of payments, current account (million US$) –41 –223 –209CPI: Consumer price index (2000=100) 105 127 136Agricultural production index (2004-2006=100) 98 127 134Food production index (2004-2006=100) 98 127 134Labour force participation, adult female pop. (%) 48.0 50.4 51.1Labour force participation, adult male pop. (%) 83.0 83.1 83.5Tourist arrivals at national borders (000) c 198 336 482Energy production, primary (000 mt oil equivalent) 1 0 ...Mobile-cellular subscriptions (per 100 inhabitants) 17.3 75.0 84.2Individuals using the Internet (%) 6.1 30.0 d 34.7 dTotal trade Major trading partners 2012(million US$) (% of exports) (% of imports)ExportsImports55.8754.8SpainPortugal71.915.1PortugalNetherlands39.912.5Balance –699.0 Areas nes 5.7 e United States 9.3Social indicatorsPopulation growth rate (average annual %) 2010-2015 0.8Urban population growth rate (average annual %) 2010-2015 2.1Rural population growth rate (average annual %) 2010-2015 –1.1Urban population (%) 2013 64.1Population aged 0-14 years (%) 2013 29.5Population aged 60+ years (females and males, % of total) 2013 8.7/5.7Sex ratio (males per 100 females) 2013 99.3Life expectancy at birth (females and males, years) 2010-2015 78.7/70.9Infant mortality rate (per 1 000 live births) 2010-2015 17.2Fertility rate, total (live births per woman) 2010-2015 2.3Contraceptive prevalence (ages 15-49, %) 2006-2012 61.3 fInternational migrant stock (000 and % of total population) mid-2013 14.9/3.0Education: Government expenditure (% of GDP) 2006-2012 5.0Education: Primary-secondary gross enrolment ratio (f/m per 100) 2006-2012 103.8/100.0Education: Female third-level students (% of total) 2006-2012 57.3Intentional homicides (females and males, per 100 000) g 2008-2010 4.8/21.9Seats held by women in national parliaments (%) 2014 20.8Environmental indicatorsThreatened species 2013 51Forested area (% of land area) 2011 21.0CO 2 emission estimates (000 metric tons and metric tons per capita) 2010 355/0.7Energy consumption per capita (kilograms oil equivalent) 2010 233.0Precipitation in the capital city, total mean (millimetres) h70 iTemperature in the capital city, mean °C (minimum and maximum) h23.5/23.5 ija Previously listed as Cape Verde. b Official rate. c Arrivals of non-resident tourists in hotels and similarestablishments. d ITU estimate. e See technical notes. f 2005. g Estimates. h Sal. i Based on WMOClimatological Normals (CLINO) for the period 1961-1990. j Refers to average temperature.World Statistics Pocketbook 35