

STATISTICS
c2drS
c2drS
- No tags were found...

You also want an ePaper? Increase the reach of your titles
YUMPU automatically turns print PDFs into web optimized ePapers that Google loves.
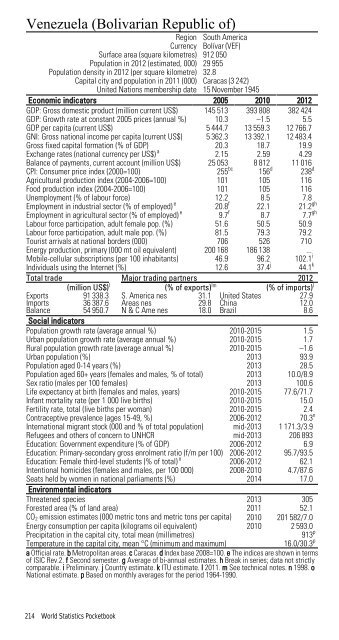
Venezuela (Bolivarian Republic of)Region South AmericaCurrency Bolívar (VEF)Surface area (square kilometres) 912 050Population in 2012 (estimated, 000) 29 955Population density in 2012 (per square kilometre) 32.8Capital city and population in 2011 (000) Caracas (3 242)United Nations membership date 15 November 1945Economic indicators 2005 2010 2012GDP: Gross domestic product (million current US$) 145 513 393 808 382 424GDP: Growth rate at constant 2005 prices (annual %) 10.3 –1.5 5.5GDP per capita (current US$) 5 444.7 13 559.3 12 766.7GNI: Gross national income per capita (current US$) 5 362.3 13 392.1 12 483.4Gross fixed capital formation (% of GDP) 20.3 18.7 19.9Exchange rates (national currency per US$) a 2.15 2.59 4.29Balance of payments, current account (million US$) 25 053 8 812 11 016CPI: Consumer price index (2000=100) 255 bc 156 d 238 dAgricultural production index (2004-2006=100) 101 105 116Food production index (2004-2006=100) 101 105 116Unemployment (% of labour force) 12.2 8.5 7.8Employment in industrial sector (% of employed) e 20.8 f 22.1 21.2 ghEmployment in agricultural sector (% of employed) e 9.7 f 8.7 7.7 ghLabour force participation, adult female pop. (%) 51.6 50.5 50.9Labour force participation, adult male pop. (%) 81.5 79.3 79.2Tourist arrivals at national borders (000) 706 526 710Energy production, primary (000 mt oil equivalent) 200 168 186 138 ...Mobile-cellular subscriptions (per 100 inhabitants) 46.9 96.2 102.1 iIndividuals using the Internet (%) 12.6 37.4 j 44.1 kTotal trade Major trading partners 2012(million US$) l (% of exports) lm (% of imports) lExports 91 338.3 S. America nes 31.1 United States 27.9Imports 36 387.6 Areas nes 29.8 China 12.0Balance 54 950.7 N & C Ame nes 18.0 Brazil 8.6Social indicatorsPopulation growth rate (average annual %) 2010-2015 1.5Urban population growth rate (average annual %) 2010-2015 1.7Rural population growth rate (average annual %) 2010-2015 –1.6Urban population (%) 2013 93.9Population aged 0-14 years (%) 2013 28.5Population aged 60+ years (females and males, % of total) 2013 10.0/8.9Sex ratio (males per 100 females) 2013 100.6Life expectancy at birth (females and males, years) 2010-2015 77.6/71.7Infant mortality rate (per 1 000 live births) 2010-2015 15.0Fertility rate, total (live births per woman) 2010-2015 2.4Contraceptive prevalence (ages 15-49, %) 2006-2012 70.3 nInternational migrant stock (000 and % of total population) mid-2013 1 171.3/3.9Refugees and others of concern to UNHCR mid-2013 206 893Education: Government expenditure (% of GDP) 2006-2012 6.9Education: Primary-secondary gross enrolment ratio (f/m per 100) 2006-2012 95.7/93.5Education: Female third-level students (% of total) o 2006-2012 62.1Intentional homicides (females and males, per 100 000) 2008-2010 4.7/87.6Seats held by women in national parliaments (%) 2014 17.0Environmental indicatorsThreatened species 2013 305Forested area (% of land area) 2011 52.1CO 2 emission estimates (000 metric tons and metric tons per capita) 2010 201 582/7.0Energy consumption per capita (kilograms oil equivalent) 2010 2 593.0Precipitation in the capital city, total mean (millimetres)913 pTemperature in the capital city, mean °C (minimum and maximum)16.0/30.3 pa Official rate. b Metropolitan areas. c Caracas. d Index base 2008=100. e The indices are shown in termsof ISIC Rev.2. f Second semester. g Average of bi-annual estimates. h Break in series; data not strictlycomparable. i Preliminary. j Country estimate. k ITU estimate. l 2011. m See technical notes. n 1998. oNational estimate. p Based on monthly averages for the period 1964-1990.214 World Statistics Pocketbook