

STATISTICS
c2drS
c2drS
- No tags were found...

Create successful ePaper yourself
Turn your PDF publications into a flip-book with our unique Google optimized e-Paper software.
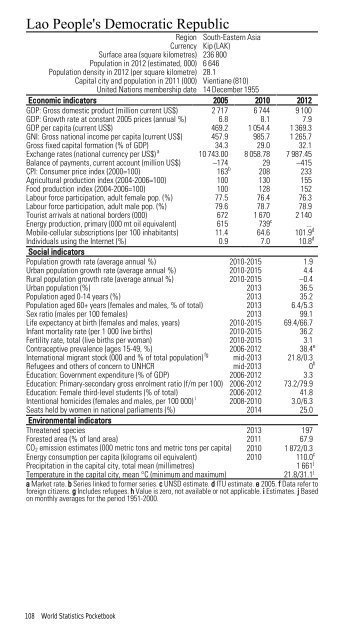
Lao People's Democratic RepublicRegion South-Eastern AsiaCurrency Kip (LAK)Surface area (square kilometres) 236 800Population in 2012 (estimated, 000) 6 646Population density in 2012 (per square kilometre) 28.1Capital city and population in 2011 (000) Vientiane (810)United Nations membership date 14 December 1955Economic indicators 2005 2010 2012GDP: Gross domestic product (million current US$) 2 717 6 744 9 100GDP: Growth rate at constant 2005 prices (annual %) 6.8 8.1 7.9GDP per capita (current US$) 469.2 1 054.4 1 369.3GNI: Gross national income per capita (current US$) 457.9 985.7 1 265.7Gross fixed capital formation (% of GDP) 34.3 29.0 32.1Exchange rates (national currency per US$) a 10 743.00 8 058.78 7 987.45Balance of payments, current account (million US$) –174 29 –415CPI: Consumer price index (2000=100) 163 b 208 233Agricultural production index (2004-2006=100) 100 130 155Food production index (2004-2006=100) 100 128 152Labour force participation, adult female pop. (%) 77.5 76.4 76.3Labour force participation, adult male pop. (%) 79.6 78.7 78.9Tourist arrivals at national borders (000) 672 1 670 2 140Energy production, primary (000 mt oil equivalent) 615 739 c ...Mobile-cellular subscriptions (per 100 inhabitants) 11.4 64.6 101.9 dIndividuals using the Internet (%) 0.9 7.0 10.8 dSocial indicatorsPopulation growth rate (average annual %) 2010-2015 1.9Urban population growth rate (average annual %) 2010-2015 4.4Rural population growth rate (average annual %) 2010-2015 –0.4Urban population (%) 2013 36.5Population aged 0-14 years (%) 2013 35.2Population aged 60+ years (females and males, % of total) 2013 6.4/5.3Sex ratio (males per 100 females) 2013 99.1Life expectancy at birth (females and males, years) 2010-2015 69.4/66.7Infant mortality rate (per 1 000 live births) 2010-2015 36.2Fertility rate, total (live births per woman) 2010-2015 3.1Contraceptive prevalence (ages 15-49, %) 2006-2012 38.4 eInternational migrant stock (000 and % of total population) fg mid-2013 21.8/0.3Refugees and others of concern to UNHCR mid-2013 0 hEducation: Government expenditure (% of GDP) 2006-2012 3.3Education: Primary-secondary gross enrolment ratio (f/m per 100) 2006-2012 73.2/79.9Education: Female third-level students (% of total) 2006-2012 41.8Intentional homicides (females and males, per 100 000) i 2008-2010 3.0/6.3Seats held by women in national parliaments (%) 2014 25.0Environmental indicatorsThreatened species 2013 197Forested area (% of land area) 2011 67.9CO 2 emission estimates (000 metric tons and metric tons per capita) 2010 1 872/0.3Energy consumption per capita (kilograms oil equivalent) 2010 110.0 cPrecipitation in the capital city, total mean (millimetres)1 661 jTemperature in the capital city, mean °C (minimum and maximum)21.8/31.1 ja Market rate. b Series linked to former series. c UNSD estimate. d ITU estimate. e 2005. f Data refer toforeign citizens. g Includes refugees. h Value is zero, not available or not applicable. i Estimates. j Basedon monthly averages for the period 1951-2000.108 World Statistics Pocketbook