

STATISTICS
c2drS
c2drS
- No tags were found...

You also want an ePaper? Increase the reach of your titles
YUMPU automatically turns print PDFs into web optimized ePapers that Google loves.
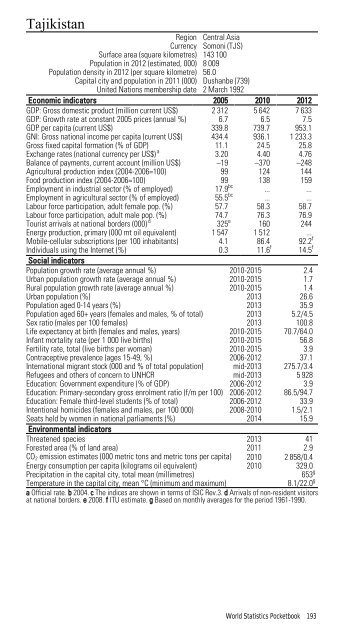
TajikistanRegion Central AsiaCurrency Somoni (TJS)Surface area (square kilometres) 143 100Population in 2012 (estimated, 000) 8 009Population density in 2012 (per square kilometre) 56.0Capital city and population in 2011 (000) Dushanbe (739)United Nations membership date 2 March 1992Economic indicators 2005 2010 2012GDP: Gross domestic product (million current US$) 2 312 5 642 7 633GDP: Growth rate at constant 2005 prices (annual %) 6.7 6.5 7.5GDP per capita (current US$) 339.8 739.7 953.1GNI: Gross national income per capita (current US$) 434.4 936.1 1 233.3Gross fixed capital formation (% of GDP) 11.1 24.5 25.8Exchange rates (national currency per US$) a 3.20 4.40 4.76Balance of payments, current account (million US$) –19 –370 –248Agricultural production index (2004-2006=100) 99 124 144Food production index (2004-2006=100) 99 138 159Employment in industrial sector (% of employed) 17.9 bc ... ...Employment in agricultural sector (% of employed) 55.5 bc ... ...Labour force participation, adult female pop. (%) 57.7 58.3 58.7Labour force participation, adult male pop. (%) 74.7 76.3 76.9Tourist arrivals at national borders (000) d 325 e 160 244Energy production, primary (000 mt oil equivalent) 1 547 1 512 ...Mobile-cellular subscriptions (per 100 inhabitants) 4.1 86.4 92.2 fIndividuals using the Internet (%) 0.3 11.6 f 14.5 fSocial indicatorsPopulation growth rate (average annual %) 2010-2015 2.4Urban population growth rate (average annual %) 2010-2015 1.7Rural population growth rate (average annual %) 2010-2015 1.4Urban population (%) 2013 26.6Population aged 0-14 years (%) 2013 35.9Population aged 60+ years (females and males, % of total) 2013 5.2/4.5Sex ratio (males per 100 females) 2013 100.8Life expectancy at birth (females and males, years) 2010-2015 70.7/64.0Infant mortality rate (per 1 000 live births) 2010-2015 56.8Fertility rate, total (live births per woman) 2010-2015 3.9Contraceptive prevalence (ages 15-49, %) 2006-2012 37.1International migrant stock (000 and % of total population) mid-2013 275.7/3.4Refugees and others of concern to UNHCR mid-2013 5 928Education: Government expenditure (% of GDP) 2006-2012 3.9Education: Primary-secondary gross enrolment ratio (f/m per 100) 2006-2012 86.5/94.7Education: Female third-level students (% of total) 2006-2012 33.9Intentional homicides (females and males, per 100 000) 2008-2010 1.5/2.1Seats held by women in national parliaments (%) 2014 15.9Environmental indicatorsThreatened species 2013 41Forested area (% of land area) 2011 2.9CO 2 emission estimates (000 metric tons and metric tons per capita) 2010 2 858/0.4Energy consumption per capita (kilograms oil equivalent) 2010 329.0Precipitation in the capital city, total mean (millimetres)653 gTemperature in the capital city, mean °C (minimum and maximum)8.1/22.0 ga Official rate. b 2004. c The indices are shown in terms of ISIC Rev.3. d Arrivals of non-resident visitorsat national borders. e 2008. f ITU estimate. g Based on monthly averages for the period 1961-1990.World Statistics Pocketbook 193