

STATISTICS
c2drS
c2drS
- No tags were found...

You also want an ePaper? Increase the reach of your titles
YUMPU automatically turns print PDFs into web optimized ePapers that Google loves.
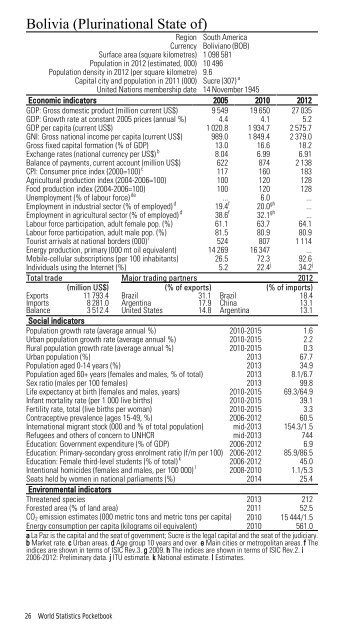
Bolivia (Plurinational State of)Region South AmericaCurrency Boliviano (BOB)Surface area (square kilometres) 1 098 581Population in 2012 (estimated, 000) 10 496Population density in 2012 (per square kilometre) 9.6Capital city and population in 2011 (000) Sucre (307) aUnited Nations membership date 14 November 1945Economic indicators 2005 2010 2012GDP: Gross domestic product (million current US$) 9 549 19 650 27 035GDP: Growth rate at constant 2005 prices (annual %) 4.4 4.1 5.2GDP per capita (current US$) 1 020.8 1 934.7 2 575.7GNI: Gross national income per capita (current US$) 989.0 1 849.4 2 379.0Gross fixed capital formation (% of GDP) 13.0 16.6 18.2Exchange rates (national currency per US$) b 8.04 6.99 6.91Balance of payments, current account (million US$) 622 874 2 138CPI: Consumer price index (2000=100) c 117 160 183Agricultural production index (2004-2006=100) 100 120 128Food production index (2004-2006=100) 100 120 128Unemployment (% of labour force) de ... 6.0 ...Employment in industrial sector (% of employed) d 19.4 f 20.0 gh ...Employment in agricultural sector (% of employed) d 38.6 f 32.1 gh ...Labour force participation, adult female pop. (%) 61.1 63.7 64.1Labour force participation, adult male pop. (%) 81.5 80.9 80.9Tourist arrivals at national borders (000) i 524 807 1 114Energy production, primary (000 mt oil equivalent) 14 269 16 347 ...Mobile-cellular subscriptions (per 100 inhabitants) 26.5 72.3 92.6Individuals using the Internet (%) 5.2 22.4 j 34.2 jTotal trade Major trading partners 2012(million US$) (% of exports) (% of imports)Exports 11 793.4 Brazil 31.1 Brazil 18.4Imports 8 281.0 Argentina 17.9 China 13.1Balance 3 512.4 United States 14.8 Argentina 13.1Social indicatorsPopulation growth rate (average annual %) 2010-2015 1.6Urban population growth rate (average annual %) 2010-2015 2.2Rural population growth rate (average annual %) 2010-2015 0.3Urban population (%) 2013 67.7Population aged 0-14 years (%) 2013 34.9Population aged 60+ years (females and males, % of total) 2013 8.1/6.7Sex ratio (males per 100 females) 2013 99.8Life expectancy at birth (females and males, years) 2010-2015 69.3/64.9Infant mortality rate (per 1 000 live births) 2010-2015 39.1Fertility rate, total (live births per woman) 2010-2015 3.3Contraceptive prevalence (ages 15-49, %) 2006-2012 60.5International migrant stock (000 and % of total population) mid-2013 154.3/1.5Refugees and others of concern to UNHCR mid-2013 744Education: Government expenditure (% of GDP) 2006-2012 6.9Education: Primary-secondary gross enrolment ratio (f/m per 100) 2006-2012 85.9/86.5Education: Female third-level students (% of total) k 2006-2012 45.0Intentional homicides (females and males, per 100 000) l 2008-2010 1.1/5.3Seats held by women in national parliaments (%) 2014 25.4Environmental indicatorsThreatened species 2013 212Forested area (% of land area) 2011 52.5CO 2 emission estimates (000 metric tons and metric tons per capita) 2010 15 444/1.5Energy consumption per capita (kilograms oil equivalent) 2010 561.0a La Paz is the capital and the seat of government; Sucre is the legal capital and the seat of the judiciary.b Market rate. c Urban areas. d Age group 10 years and over. e Main cities or metropolitan areas. f Theindices are shown in terms of ISIC Rev.3. g 2009. h The indices are shown in terms of ISIC Rev.2. i2006-2012: Preliminary data. j ITU estimate. k National estimate. l Estimates.26 World Statistics Pocketbook