

STATISTICS
c2drS
c2drS
- No tags were found...

You also want an ePaper? Increase the reach of your titles
YUMPU automatically turns print PDFs into web optimized ePapers that Google loves.
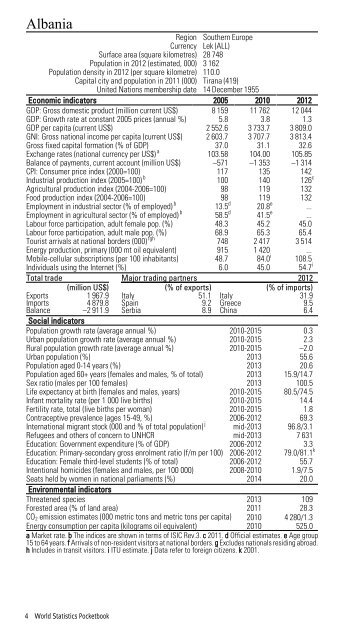
AlbaniaRegion Southern EuropeCurrency Lek (ALL)Surface area (square kilometres) 28 748Population in 2012 (estimated, 000) 3 162Population density in 2012 (per square kilometre) 110.0Capital city and population in 2011 (000) Tirana (419)United Nations membership date 14 December 1955Economic indicators 2005 2010 2012GDP: Gross domestic product (million current US$) 8 159 11 762 12 044GDP: Growth rate at constant 2005 prices (annual %) 5.8 3.8 1.3GDP per capita (current US$) 2 552.6 3 733.7 3 809.0GNI: Gross national income per capita (current US$) 2 603.7 3 707.7 3 813.4Gross fixed capital formation (% of GDP) 37.0 31.1 32.6Exchange rates (national currency per US$) a 103.58 104.00 105.85Balance of payments, current account (million US$) –571 –1 353 –1 314CPI: Consumer price index (2000=100) 117 135 142Industrial production index (2005=100) b 100 140 126 cAgricultural production index (2004-2006=100) 98 119 132Food production index (2004-2006=100) 98 119 132Employment in industrial sector (% of employed) b 13.5 d 20.8 e ...Employment in agricultural sector (% of employed) b 58.5 d 41.5 e ...Labour force participation, adult female pop. (%) 48.3 45.2 45.0Labour force participation, adult male pop. (%) 68.9 65.3 65.4Tourist arrivals at national borders (000) fgh 748 2 417 3 514Energy production, primary (000 mt oil equivalent) 915 1 420 ...Mobile-cellular subscriptions (per 100 inhabitants) 48.7 84.0 i 108.5Individuals using the Internet (%) 6.0 45.0 54.7 iTotal trade Major trading partners 2012(million US$) (% of exports) (% of imports)Exports 1 967.9 Italy 51.1 Italy 31.9Imports 4 879.8 Spain 9.2 Greece 9.5Balance –2 911.9 Serbia 8.9 China 6.4Social indicatorsPopulation growth rate (average annual %) 2010-2015 0.3Urban population growth rate (average annual %) 2010-2015 2.3Rural population growth rate (average annual %) 2010-2015 –2.0Urban population (%) 2013 55.6Population aged 0-14 years (%) 2013 20.6Population aged 60+ years (females and males, % of total) 2013 15.9/14.7Sex ratio (males per 100 females) 2013 100.5Life expectancy at birth (females and males, years) 2010-2015 80.5/74.5Infant mortality rate (per 1 000 live births) 2010-2015 14.4Fertility rate, total (live births per woman) 2010-2015 1.8Contraceptive prevalence (ages 15-49, %) 2006-2012 69.3International migrant stock (000 and % of total population) j mid-2013 96.8/3.1Refugees and others of concern to UNHCR mid-2013 7 631Education: Government expenditure (% of GDP) 2006-2012 3.3Education: Primary-secondary gross enrolment ratio (f/m per 100) 2006-2012 79.0/81.1 kEducation: Female third-level students (% of total) 2006-2012 55.7Intentional homicides (females and males, per 100 000) 2008-2010 1.9/7.5Seats held by women in national parliaments (%) 2014 20.0Environmental indicatorsThreatened species 2013 109Forested area (% of land area) 2011 28.3CO 2 emission estimates (000 metric tons and metric tons per capita) 2010 4 280/1.3Energy consumption per capita (kilograms oil equivalent) 2010 525.0a Market rate. b The indices are shown in terms of ISIC Rev.3. c 2011. d Official estimates. e Age group15 to 64 years. f Arrivals of non-resident visitors at national borders. g Excludes nationals residing abroad.h Includes in transit visitors. i ITU estimate. j Data refer to foreign citizens. k 2001.4 World Statistics Pocketbook