

STATISTICS
c2drS
c2drS
- No tags were found...

Create successful ePaper yourself
Turn your PDF publications into a flip-book with our unique Google optimized e-Paper software.
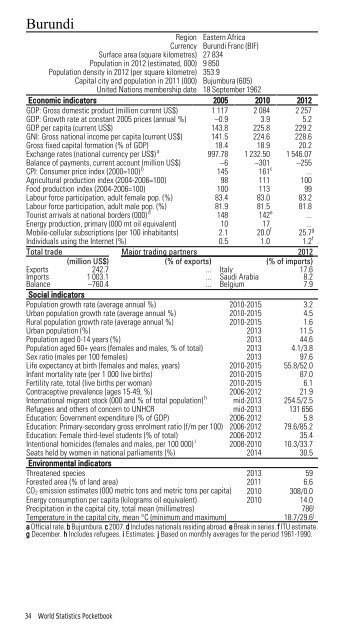
BurundiRegion Eastern AfricaCurrency Burundi Franc (BIF)Surface area (square kilometres) 27 834Population in 2012 (estimated, 000) 9 850Population density in 2012 (per square kilometre) 353.9Capital city and population in 2011 (000) Bujumbura (605)United Nations membership date 18 September 1962Economic indicators 2005 2010 2012GDP: Gross domestic product (million current US$) 1 117 2 084 2 257GDP: Growth rate at constant 2005 prices (annual %) –0.9 3.9 5.2GDP per capita (current US$) 143.8 225.8 229.2GNI: Gross national income per capita (current US$) 141.5 224.6 228.6Gross fixed capital formation (% of GDP) 18.4 18.9 20.2Exchange rates (national currency per US$) a 997.78 1 232.50 1 546.07Balance of payments, current account (million US$) –6 –301 –255CPI: Consumer price index (2000=100) b 145 161 c ...Agricultural production index (2004-2006=100) 98 111 100Food production index (2004-2006=100) 100 113 99Labour force participation, adult female pop. (%) 83.4 83.0 83.2Labour force participation, adult male pop. (%) 81.9 81.5 81.8Tourist arrivals at national borders (000) d 148 142 e ...Energy production, primary (000 mt oil equivalent) 10 17 ...Mobile-cellular subscriptions (per 100 inhabitants) 2.1 20.0 f 25.7 gIndividuals using the Internet (%) 0.5 1.0 1.2 fTotal trade Major trading partners 2012(million US$) (% of exports) (% of imports)Exports 242.7 ... Italy 17.6Imports 1 003.1 ... Saudi Arabia 8.2Balance –760.4 ... Belgium 7.9Social indicatorsPopulation growth rate (average annual %) 2010-2015 3.2Urban population growth rate (average annual %) 2010-2015 4.5Rural population growth rate (average annual %) 2010-2015 1.6Urban population (%) 2013 11.5Population aged 0-14 years (%) 2013 44.6Population aged 60+ years (females and males, % of total) 2013 4.1/3.8Sex ratio (males per 100 females) 2013 97.6Life expectancy at birth (females and males, years) 2010-2015 55.8/52.0Infant mortality rate (per 1 000 live births) 2010-2015 87.0Fertility rate, total (live births per woman) 2010-2015 6.1Contraceptive prevalence (ages 15-49, %) 2006-2012 21.9International migrant stock (000 and % of total population) h mid-2013 254.5/2.5Refugees and others of concern to UNHCR mid-2013 131 656Education: Government expenditure (% of GDP) 2006-2012 5.8Education: Primary-secondary gross enrolment ratio (f/m per 100) 2006-2012 79.6/85.2Education: Female third-level students (% of total) 2006-2012 35.4Intentional homicides (females and males, per 100 000) i 2008-2010 10.3/33.7Seats held by women in national parliaments (%) 2014 30.5Environmental indicatorsThreatened species 2013 59Forested area (% of land area) 2011 6.6CO 2 emission estimates (000 metric tons and metric tons per capita) 2010 308/0.0Energy consumption per capita (kilograms oil equivalent) 2010 14.0Precipitation in the capital city, total mean (millimetres)786 jTemperature in the capital city, mean °C (minimum and maximum)18.7/29.6 ja Official rate. b Bujumbura. c 2007. d Includes nationals residing abroad. e Break in series. f ITU estimate.g December. h Includes refugees. i Estimates. j Based on monthly averages for the period 1961-1990.34 World Statistics Pocketbook