

STATISTICS
c2drS
c2drS
- No tags were found...

You also want an ePaper? Increase the reach of your titles
YUMPU automatically turns print PDFs into web optimized ePapers that Google loves.
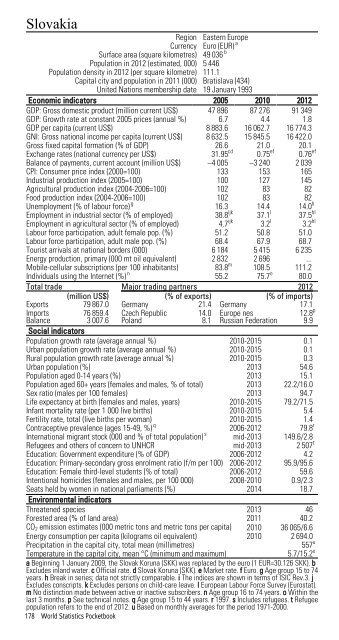
SlovakiaRegion Eastern EuropeCurrency Euro (EUR) aSurface area (square kilometres) 49 036 bPopulation in 2012 (estimated, 000) 5 446Population density in 2012 (per square kilometre) 111.1Capital city and population in 2011 (000) Bratislava (434)United Nations membership date 19 January 1993Economic indicators 2005 2010 2012GDP: Gross domestic product (million current US$) 47 896 87 276 91 349GDP: Growth rate at constant 2005 prices (annual %) 6.7 4.4 1.8GDP per capita (current US$) 8 883.6 16 062.7 16 774.3GNI: Gross national income per capita (current US$) 8 632.5 15 845.5 16 422.0Gross fixed capital formation (% of GDP) 26.6 21.0 20.1Exchange rates (national currency per US$) 31.95 cd 0.75 ef 0.76 efBalance of payments, current account (million US$) –4 005 –3 240 2 039CPI: Consumer price index (2000=100) 133 153 165Industrial production index (2005=100) 100 127 145Agricultural production index (2004-2006=100) 102 83 82Food production index (2004-2006=100) 102 83 82Unemployment (% of labour force) g 16.3 14.4 14.0 hEmployment in industrial sector (% of employed) 38.8 ijk 37.1 l 37.5 hlEmployment in agricultural sector (% of employed) 4.7 ijk 3.2 l 3.2 hlLabour force participation, adult female pop. (%) 51.2 50.8 51.0Labour force participation, adult male pop. (%) 68.4 67.9 68.7Tourist arrivals at national borders (000) 6 184 5 415 6 235Energy production, primary (000 mt oil equivalent) 2 832 2 696 ...Mobile-cellular subscriptions (per 100 inhabitants) 83.8 m 108.5 111.2Individuals using the Internet (%) n 55.2 75.7 o 80.0Total trade Major trading partners 2012(million US$) (% of exports) (% of imports)Exports 79 867.0 Germany 21.4 Germany 17.1ImportsBalance76 859.43 007.6Czech RepublicPoland14.08.1Europe nesRussian Federation12.8 p9.9Social indicatorsPopulation growth rate (average annual %) 2010-2015 0.1Urban population growth rate (average annual %) 2010-2015 0.1Rural population growth rate (average annual %) 2010-2015 0.3Urban population (%) 2013 54.6Population aged 0-14 years (%) 2013 15.1Population aged 60+ years (females and males, % of total) 2013 22.2/16.0Sex ratio (males per 100 females) 2013 94.7Life expectancy at birth (females and males, years) 2010-2015 79.2/71.5Infant mortality rate (per 1 000 live births) 2010-2015 5.4Fertility rate, total (live births per woman) 2010-2015 1.4Contraceptive prevalence (ages 15-49, %) q 2006-2012 79.8 rInternational migrant stock (000 and % of total population) s mid-2013 149.6/2.8Refugees and others of concern to UNHCR mid-2013 2 507 tEducation: Government expenditure (% of GDP) 2006-2012 4.2Education: Primary-secondary gross enrolment ratio (f/m per 100) 2006-2012 95.9/95.6Education: Female third-level students (% of total) 2006-2012 59.6Intentional homicides (females and males, per 100 000) 2008-2010 0.9/2.3Seats held by women in national parliaments (%) 2014 18.7Environmental indicatorsThreatened species 2013 46Forested area (% of land area) 2011 40.2CO 2 emission estimates (000 metric tons and metric tons per capita) 2010 36 065/6.6Energy consumption per capita (kilograms oil equivalent) 2010 2 694.0Precipitation in the capital city, total mean (millimetres)557 uTemperature in the capital city, mean °C (minimum and maximum)5.7/15.2 ua Beginning 1 January 2009, the Slovak Koruna (SKK) was replaced by the euro (1 EUR=30.126 SKK). bExcludes inland water. c Official rate. d Slovak Koruna (SKK). e Market rate. f Euro. g Age group 15 to 74years. h Break in series; data not strictly comparable. i The indices are shown in terms of ISIC Rev.3. jExcludes conscripts. k Excludes persons on child-care leave. l European Labour Force Survey (Eurostat).m No distinction made between active or inactive subscribers. n Age group 16 to 74 years. o Within thelast 3 months. p See technical notes. q Age group 15 to 44 years. r 1997. s Includes refugees. t Refugeepopulation refers to the end of 2012. u Based on monthly averages for the period 1971-2000.178 World Statistics Pocketbook