

STATISTICS
c2drS
c2drS
- No tags were found...

Create successful ePaper yourself
Turn your PDF publications into a flip-book with our unique Google optimized e-Paper software.
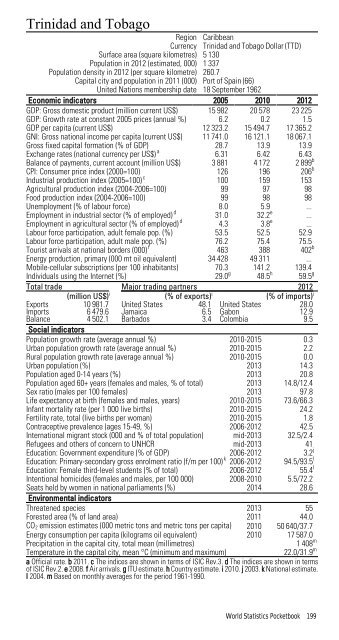
Trinidad and TobagoRegion CaribbeanCurrency Trinidad and Tobago Dollar (TTD)Surface area (square kilometres) 5 130Population in 2012 (estimated, 000) 1 337Population density in 2012 (per square kilometre) 260.7Capital city and population in 2011 (000) Port of Spain (66)United Nations membership date 18 September 1962Economic indicators 2005 2010 2012GDP: Gross domestic product (million current US$) 15 982 20 578 23 225GDP: Growth rate at constant 2005 prices (annual %) 6.2 0.2 1.5GDP per capita (current US$) 12 323.2 15 494.7 17 365.2GNI: Gross national income per capita (current US$) 11 741.0 16 121.1 18 067.1Gross fixed capital formation (% of GDP) 28.7 13.9 13.9Exchange rates (national currency per US$) a 6.31 6.42 6.43Balance of payments, current account (million US$) 3 881 4 172 2 899 bCPI: Consumer price index (2000=100) 126 196 206 bIndustrial production index (2005=100) c 100 159 153Agricultural production index (2004-2006=100) 99 97 98Food production index (2004-2006=100) 99 98 98Unemployment (% of labour force) 8.0 5.9 ...Employment in industrial sector (% of employed) d 31.0 32.2 e ...Employment in agricultural sector (% of employed) d 4.3 3.8 e ...Labour force participation, adult female pop. (%) 53.5 52.5 52.9Labour force participation, adult male pop. (%) 76.2 75.4 75.5Tourist arrivals at national borders (000) f 463 388 402 bEnergy production, primary (000 mt oil equivalent) 34 428 49 311 ...Mobile-cellular subscriptions (per 100 inhabitants) 70.3 141.2 139.4Individuals using the Internet (%) 29.0 g 48.5 h 59.5 gTotal trade Major trading partners 2012(million US$) i (% of exports) i (% of imports) iExports 10 981.7 United States 48.1 United States 28.0Imports 6 479.6 Jamaica 6.5 Gabon 12.9Balance 4 502.1 Barbados 3.4 Colombia 9.5Social indicatorsPopulation growth rate (average annual %) 2010-2015 0.3Urban population growth rate (average annual %) 2010-2015 2.2Rural population growth rate (average annual %) 2010-2015 0.0Urban population (%) 2013 14.3Population aged 0-14 years (%) 2013 20.8Population aged 60+ years (females and males, % of total) 2013 14.8/12.4Sex ratio (males per 100 females) 2013 97.8Life expectancy at birth (females and males, years) 2010-2015 73.6/66.3Infant mortality rate (per 1 000 live births) 2010-2015 24.2Fertility rate, total (live births per woman) 2010-2015 1.8Contraceptive prevalence (ages 15-49, %) 2006-2012 42.5International migrant stock (000 and % of total population) mid-2013 32.5/2.4Refugees and others of concern to UNHCR mid-2013 41Education: Government expenditure (% of GDP) 2006-2012 3.2 jEducation: Primary-secondary gross enrolment ratio (f/m per 100) k 2006-2012 94.5/93.5 lEducation: Female third-level students (% of total) 2006-2012 55.4 lIntentional homicides (females and males, per 100 000) 2008-2010 5.5/72.2Seats held by women in national parliaments (%) 2014 28.6Environmental indicatorsThreatened species 2013 55Forested area (% of land area) 2011 44.0CO 2 emission estimates (000 metric tons and metric tons per capita) 2010 50 640/37.7Energy consumption per capita (kilograms oil equivalent) 2010 17 587.0Precipitation in the capital city, total mean (millimetres)1 408 mTemperature in the capital city, mean °C (minimum and maximum)22.0/31.9 ma Official rate. b 2011. c The indices are shown in terms of ISIC Rev.3. d The indices are shown in termsof ISIC Rev.2. e 2008. f Air arrivals. g ITU estimate. h Country estimate. i 2010. j 2003. k National estimate.l 2004. m Based on monthly averages for the period 1961-1990.World Statistics Pocketbook 199