

STATISTICS
c2drS
c2drS
- No tags were found...

You also want an ePaper? Increase the reach of your titles
YUMPU automatically turns print PDFs into web optimized ePapers that Google loves.
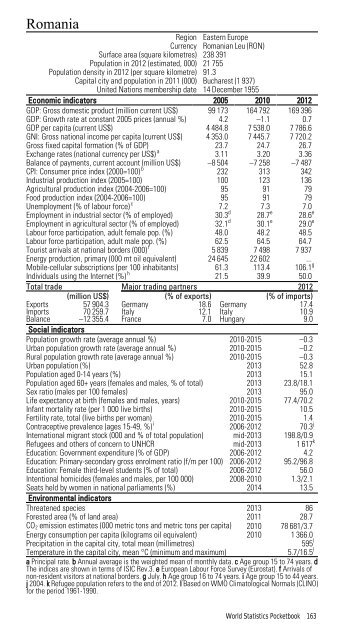
RomaniaRegion Eastern EuropeCurrency Romanian Leu (RON)Surface area (square kilometres) 238 391Population in 2012 (estimated, 000) 21 755Population density in 2012 (per square kilometre) 91.3Capital city and population in 2011 (000) Bucharest (1 937)United Nations membership date 14 December 1955Economic indicators 2005 2010 2012GDP: Gross domestic product (million current US$) 99 173 164 792 169 396GDP: Growth rate at constant 2005 prices (annual %) 4.2 –1.1 0.7GDP per capita (current US$) 4 484.8 7 538.0 7 786.6GNI: Gross national income per capita (current US$) 4 353.0 7 445.7 7 720.2Gross fixed capital formation (% of GDP) 23.7 24.7 26.7Exchange rates (national currency per US$) a 3.11 3.20 3.36Balance of payments, current account (million US$) –8 504 –7 258 –7 487CPI: Consumer price index (2000=100) b 232 313 342Industrial production index (2005=100) 100 123 136Agricultural production index (2004-2006=100) 95 91 79Food production index (2004-2006=100) 95 91 79Unemployment (% of labour force) c 7.2 7.3 7.0Employment in industrial sector (% of employed) 30.3 d 28.7 e 28.6 eEmployment in agricultural sector (% of employed) 32.1 d 30.1 e 29.0 eLabour force participation, adult female pop. (%) 48.0 48.2 48.5Labour force participation, adult male pop. (%) 62.5 64.5 64.7Tourist arrivals at national borders (000) f 5 839 7 498 7 937Energy production, primary (000 mt oil equivalent) 24 645 22 602 ...Mobile-cellular subscriptions (per 100 inhabitants) 61.3 113.4 106.1 gIndividuals using the Internet (%) h 21.5 39.9 50.0Total trade Major trading partners 2012(million US$) (% of exports) (% of imports)Exports 57 904.3 Germany 18.6 Germany 17.4Imports 70 259.7 Italy 12.1 Italy 10.9Balance –12 355.4 France 7.0 Hungary 9.0Social indicatorsPopulation growth rate (average annual %) 2010-2015 –0.3Urban population growth rate (average annual %) 2010-2015 –0.2Rural population growth rate (average annual %) 2010-2015 –0.3Urban population (%) 2013 52.8Population aged 0-14 years (%) 2013 15.1Population aged 60+ years (females and males, % of total) 2013 23.8/18.1Sex ratio (males per 100 females) 2013 95.0Life expectancy at birth (females and males, years) 2010-2015 77.4/70.2Infant mortality rate (per 1 000 live births) 2010-2015 10.5Fertility rate, total (live births per woman) 2010-2015 1.4Contraceptive prevalence (ages 15-49, %) i 2006-2012 70.3 jInternational migrant stock (000 and % of total population) mid-2013 198.8/0.9Refugees and others of concern to UNHCR mid-2013 1 617 kEducation: Government expenditure (% of GDP) 2006-2012 4.2Education: Primary-secondary gross enrolment ratio (f/m per 100) 2006-2012 95.2/96.8Education: Female third-level students (% of total) 2006-2012 56.0Intentional homicides (females and males, per 100 000) 2008-2010 1.3/2.1Seats held by women in national parliaments (%) 2014 13.5Environmental indicatorsThreatened species 2013 86Forested area (% of land area) 2011 28.7CO 2 emission estimates (000 metric tons and metric tons per capita) 2010 78 681/3.7Energy consumption per capita (kilograms oil equivalent) 2010 1 366.0Precipitation in the capital city, total mean (millimetres)595 lTemperature in the capital city, mean °C (minimum and maximum)5.7/16.5 la Principal rate. b Annual average is the weighted mean of monthly data. c Age group 15 to 74 years. dThe indices are shown in terms of ISIC Rev.3. e European Labour Force Survey (Eurostat). f Arrivals ofnon-resident visitors at national borders. g July. h Age group 16 to 74 years. i Age group 15 to 44 years.j 2004. k Refugee population refers to the end of 2012. l Based on WMO Climatological Normals (CLINO)for the period 1961-1990.World Statistics Pocketbook 163