

STATISTICS
c2drS
c2drS
- No tags were found...

You also want an ePaper? Increase the reach of your titles
YUMPU automatically turns print PDFs into web optimized ePapers that Google loves.
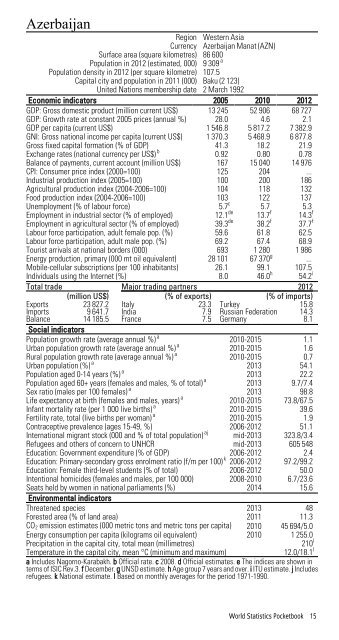
AzerbaijanRegion Western AsiaCurrency Azerbaijan Manat (AZN)Surface area (square kilometres) 86 600Population in 2012 (estimated, 000) 9 309 aPopulation density in 2012 (per square kilometre) 107.5Capital city and population in 2011 (000) Baku (2 123)United Nations membership date 2 March 1992Economic indicators 2005 2010 2012GDP: Gross domestic product (million current US$) 13 245 52 906 68 727GDP: Growth rate at constant 2005 prices (annual %) 28.0 4.6 2.1GDP per capita (current US$) 1 546.8 5 817.2 7 382.9GNI: Gross national income per capita (current US$) 1 370.3 5 468.9 6 877.8Gross fixed capital formation (% of GDP) 41.3 18.2 21.9Exchange rates (national currency per US$) b 0.92 0.80 0.78Balance of payments, current account (million US$) 167 15 040 14 976CPI: Consumer price index (2000=100) 125 204 ...Industrial production index (2005=100) 100 200 186Agricultural production index (2004-2006=100) 104 118 132Food production index (2004-2006=100) 103 122 137Unemployment (% of labour force) 5.7 c 5.7 5.3Employment in industrial sector (% of employed) 12.1 de 13.7 f 14.3 fEmployment in agricultural sector (% of employed) 39.3 de 38.2 f 37.7 fLabour force participation, adult female pop. (%) 59.6 61.8 62.5Labour force participation, adult male pop. (%) 69.2 67.4 68.9Tourist arrivals at national borders (000) 693 1 280 1 986Energy production, primary (000 mt oil equivalent) 28 101 67 370 g ...Mobile-cellular subscriptions (per 100 inhabitants) 26.1 99.1 107.5Individuals using the Internet (%) 8.0 46.0 h 54.2 iTotal trade Major trading partners 2012(million US$) (% of exports) (% of imports)Exports 23 827.2 Italy 23.3 Turkey 15.8Imports 9 641.7 India 7.9 Russian Federation 14.3Balance 14 185.5 France 7.5 Germany 8.1Social indicatorsPopulation growth rate (average annual %) a 2010-2015 1.1Urban population growth rate (average annual %) a 2010-2015 1.6Rural population growth rate (average annual %) a 2010-2015 0.7Urban population (%) a 2013 54.1Population aged 0-14 years (%) a 2013 22.2Population aged 60+ years (females and males, % of total) a 2013 9.7/7.4Sex ratio (males per 100 females) a 2013 98.8Life expectancy at birth (females and males, years) a 2010-2015 73.8/67.5Infant mortality rate (per 1 000 live births) a 2010-2015 39.6Fertility rate, total (live births per woman) a 2010-2015 1.9Contraceptive prevalence (ages 15-49, %) 2006-2012 51.1International migrant stock (000 and % of total population) aj mid-2013 323.8/3.4Refugees and others of concern to UNHCR mid-2013 605 548Education: Government expenditure (% of GDP) 2006-2012 2.4Education: Primary-secondary gross enrolment ratio (f/m per 100) k 2006-2012 97.2/99.2Education: Female third-level students (% of total) 2006-2012 50.0Intentional homicides (females and males, per 100 000) 2008-2010 6.7/23.6Seats held by women in national parliaments (%) 2014 15.6Environmental indicatorsThreatened species 2013 48Forested area (% of land area) 2011 11.3CO 2 emission estimates (000 metric tons and metric tons per capita) 2010 45 694/5.0Energy consumption per capita (kilograms oil equivalent) 2010 1 255.0Precipitation in the capital city, total mean (millimetres)210 lTemperature in the capital city, mean °C (minimum and maximum)12.0/18.1 la Includes Nagorno-Karabakh. b Official rate. c 2008. d Official estimates. e The indices are shown interms of ISIC Rev.3. f December. g UNSD estimate. h Age group 7 years and over. i ITU estimate. j Includesrefugees. k National estimate. l Based on monthly averages for the period 1971-1990.World Statistics Pocketbook 15