

STATISTICS
c2drS
c2drS
- No tags were found...

You also want an ePaper? Increase the reach of your titles
YUMPU automatically turns print PDFs into web optimized ePapers that Google loves.
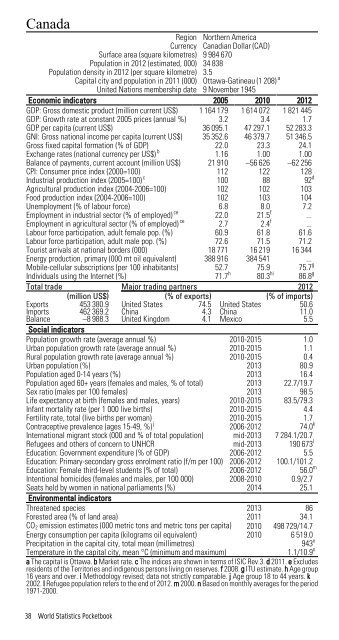
CanadaRegion Northern AmericaCurrency Canadian Dollar (CAD)Surface area (square kilometres) 9 984 670Population in 2012 (estimated, 000) 34 838Population density in 2012 (per square kilometre) 3.5Capital city and population in 2011 (000) Ottawa-Gatineau (1 208) aUnited Nations membership date 9 November 1945Economic indicators 2005 2010 2012GDP: Gross domestic product (million current US$) 1 164 179 1 614 072 1 821 445GDP: Growth rate at constant 2005 prices (annual %) 3.2 3.4 1.7GDP per capita (current US$) 36 095.1 47 297.1 52 283.3GNI: Gross national income per capita (current US$) 35 352.6 46 379.7 51 346.5Gross fixed capital formation (% of GDP) 22.0 23.3 24.1Exchange rates (national currency per US$) b 1.16 1.00 1.00Balance of payments, current account (million US$) 21 910 –56 626 –62 256CPI: Consumer price index (2000=100) 112 122 128Industrial production index (2005=100) c 100 88 92 dAgricultural production index (2004-2006=100) 102 102 103Food production index (2004-2006=100) 102 103 104Unemployment (% of labour force) 6.8 8.0 7.2Employment in industrial sector (% of employed) ce 22.0 21.5 f ...Employment in agricultural sector (% of employed) ce 2.7 2.4 f ...Labour force participation, adult female pop. (%) 60.9 61.8 61.6Labour force participation, adult male pop. (%) 72.6 71.5 71.2Tourist arrivals at national borders (000) 18 771 16 219 16 344Energy production, primary (000 mt oil equivalent) 388 916 384 541 ...Mobile-cellular subscriptions (per 100 inhabitants) 52.7 75.9 75.7 gIndividuals using the Internet (%) 71.7 h 80.3 hi 86.8 gTotal trade Major trading partners 2012(million US$) (% of exports) (% of imports)Exports 453 380.9 United States 74.5 United States 50.6Imports 462 369.2 China 4.3 China 11.0Balance –8 988.3 United Kingdom 4.1 Mexico 5.5Social indicatorsPopulation growth rate (average annual %) 2010-2015 1.0Urban population growth rate (average annual %) 2010-2015 1.1Rural population growth rate (average annual %) 2010-2015 0.4Urban population (%) 2013 80.9Population aged 0-14 years (%) 2013 16.4Population aged 60+ years (females and males, % of total) 2013 22.7/19.7Sex ratio (males per 100 females) 2013 98.5Life expectancy at birth (females and males, years) 2010-2015 83.5/79.3Infant mortality rate (per 1 000 live births) 2010-2015 4.4Fertility rate, total (live births per woman) 2010-2015 1.7Contraceptive prevalence (ages 15-49, %) j 2006-2012 74.0 kInternational migrant stock (000 and % of total population) mid-2013 7 284.1/20.7Refugees and others of concern to UNHCR mid-2013 190 673 lEducation: Government expenditure (% of GDP) 2006-2012 5.5Education: Primary-secondary gross enrolment ratio (f/m per 100) 2006-2012 100.1/101.2Education: Female third-level students (% of total) 2006-2012 56.0 mIntentional homicides (females and males, per 100 000) 2008-2010 0.9/2.7Seats held by women in national parliaments (%) 2014 25.1Environmental indicatorsThreatened species 2013 86Forested area (% of land area) 2011 34.1CO 2 emission estimates (000 metric tons and metric tons per capita) 2010 498 729/14.7Energy consumption per capita (kilograms oil equivalent) 2010 6 519.0Precipitation in the capital city, total mean (millimetres)943 nTemperature in the capital city, mean °C (minimum and maximum)1.1/10.9 na The capital is Ottawa. b Market rate. c The indices are shown in terms of ISIC Rev.3. d 2011. e Excludesresidents of the Territories and indigenous persons living on reserves. f 2008. g ITU estimate. h Age group16 years and over. i Methodology revised; data not strictly comparable. j Age group 18 to 44 years. k2002. l Refugee population refers to the end of 2012. m 2000. n Based on monthly averages for the period1971-2000.38 World Statistics Pocketbook