

STATISTICS
c2drS
c2drS
- No tags were found...

Create successful ePaper yourself
Turn your PDF publications into a flip-book with our unique Google optimized e-Paper software.
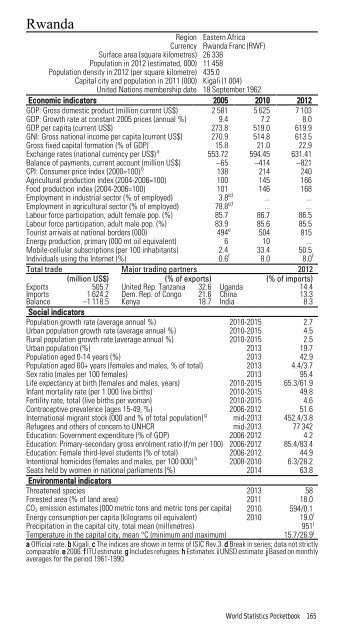
RwandaRegion Eastern AfricaCurrency Rwanda Franc (RWF)Surface area (square kilometres) 26 338Population in 2012 (estimated, 000) 11 458Population density in 2012 (per square kilometre) 435.0Capital city and population in 2011 (000) Kigali (1 004)United Nations membership date 18 September 1962Economic indicators 2005 2010 2012GDP: Gross domestic product (million current US$) 2 581 5 625 7 103GDP: Growth rate at constant 2005 prices (annual %) 9.4 7.2 8.0GDP per capita (current US$) 273.8 519.0 619.9GNI: Gross national income per capita (current US$) 270.9 514.8 613.5Gross fixed capital formation (% of GDP) 15.8 21.0 22.9Exchange rates (national currency per US$) a 553.72 594.45 631.41Balance of payments, current account (million US$) –65 –414 –821CPI: Consumer price index (2000=100) b 138 214 240Agricultural production index (2004-2006=100) 100 145 166Food production index (2004-2006=100) 101 146 168Employment in industrial sector (% of employed) 3.8 cd ... ...Employment in agricultural sector (% of employed) 78.8 cd ... ...Labour force participation, adult female pop. (%) 85.7 86.7 86.5Labour force participation, adult male pop. (%) 83.9 85.6 85.5Tourist arrivals at national borders (000) 494 e 504 815Energy production, primary (000 mt oil equivalent) 6 10 ...Mobile-cellular subscriptions (per 100 inhabitants) 2.4 33.4 50.5Individuals using the Internet (%) 0.6 f 8.0 8.0 fTotal trade Major trading partners 2012(million US$) (% of exports) (% of imports)Exports 505.7 United Rep. Tanzania 32.6 Uganda 14.4Imports 1 624.2 Dem. Rep. of Congo 21.6 China 13.3Balance –1 118.5 Kenya 18.7 India 8.3Social indicatorsPopulation growth rate (average annual %) 2010-2015 2.7Urban population growth rate (average annual %) 2010-2015 4.5Rural population growth rate (average annual %) 2010-2015 2.5Urban population (%) 2013 19.7Population aged 0-14 years (%) 2013 42.9Population aged 60+ years (females and males, % of total) 2013 4.4/3.7Sex ratio (males per 100 females) 2013 95.4Life expectancy at birth (females and males, years) 2010-2015 65.3/61.9Infant mortality rate (per 1 000 live births) 2010-2015 49.8Fertility rate, total (live births per woman) 2010-2015 4.6Contraceptive prevalence (ages 15-49, %) 2006-2012 51.6International migrant stock (000 and % of total population) g mid-2013 452.4/3.8Refugees and others of concern to UNHCR mid-2013 77 342Education: Government expenditure (% of GDP) 2006-2012 4.2Education: Primary-secondary gross enrolment ratio (f/m per 100) 2006-2012 85.4/83.4Education: Female third-level students (% of total) 2006-2012 44.9Intentional homicides (females and males, per 100 000) h 2008-2010 6.3/28.2Seats held by women in national parliaments (%) 2014 63.8Environmental indicatorsThreatened species 2013 58Forested area (% of land area) 2011 18.0CO 2 emission estimates (000 metric tons and metric tons per capita) 2010 594/0.1Energy consumption per capita (kilograms oil equivalent) 2010 19.0 iPrecipitation in the capital city, total mean (millimetres)951 jTemperature in the capital city, mean °C (minimum and maximum)15.7/26.9 ja Official rate. b Kigali. c The indices are shown in terms of ISIC Rev.3. d Break in series; data not strictlycomparable. e 2006. f ITU estimate. g Includes refugees. h Estimates. i UNSD estimate. j Based on monthlyaverages for the period 1961-1990.World Statistics Pocketbook 165