

STATISTICS
c2drS
c2drS
- No tags were found...

Create successful ePaper yourself
Turn your PDF publications into a flip-book with our unique Google optimized e-Paper software.
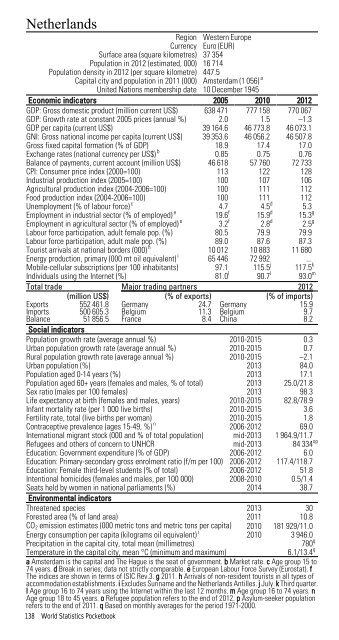
NetherlandsRegion Western EuropeCurrency Euro (EUR)Surface area (square kilometres) 37 354Population in 2012 (estimated, 000) 16 714Population density in 2012 (per square kilometre) 447.5Capital city and population in 2011 (000) Amsterdam (1 056) aUnited Nations membership date 10 December 1945Economic indicators 2005 2010 2012GDP: Gross domestic product (million current US$) 638 471 777 158 770 067GDP: Growth rate at constant 2005 prices (annual %) 2.0 1.5 –1.3GDP per capita (current US$) 39 164.6 46 773.8 46 073.1GNI: Gross national income per capita (current US$) 39 353.6 46 056.2 46 507.8Gross fixed capital formation (% of GDP) 18.9 17.4 17.0Exchange rates (national currency per US$) b 0.85 0.75 0.76Balance of payments, current account (million US$) 46 618 57 760 72 733CPI: Consumer price index (2000=100) 113 122 128Industrial production index (2005=100) 100 107 106Agricultural production index (2004-2006=100) 100 111 112Food production index (2004-2006=100) 100 111 112Unemployment (% of labour force) c 4.7 4.5 d 5.3Employment in industrial sector (% of employed) e 19.6 f 15.9 d 15.3 gEmployment in agricultural sector (% of employed) e 3.2 f 2.8 d 2.5 gLabour force participation, adult female pop. (%) 80.5 79.9 79.9Labour force participation, adult male pop. (%) 89.0 87.6 87.3Tourist arrivals at national borders (000) h 10 012 10 883 11 680Energy production, primary (000 mt oil equivalent) i 65 446 72 992 ...Mobile-cellular subscriptions (per 100 inhabitants) 97.1 115.5 j 117.5 kIndividuals using the Internet (%) 81.0 l 90.7 l 93.0 mTotal trade Major trading partners 2012(million US$) (% of exports) (% of imports)Exports 552 461.8 Germany 24.7 Germany 15.9Imports 500 605.3 Belgium 11.3 Belgium 9.7Balance 51 856.5 France 8.4 China 8.2Social indicatorsPopulation growth rate (average annual %) 2010-2015 0.3Urban population growth rate (average annual %) 2010-2015 0.7Rural population growth rate (average annual %) 2010-2015 –2.1Urban population (%) 2013 84.0Population aged 0-14 years (%) 2013 17.1Population aged 60+ years (females and males, % of total) 2013 25.0/21.8Sex ratio (males per 100 females) 2013 98.3Life expectancy at birth (females and males, years) 2010-2015 82.8/78.9Infant mortality rate (per 1 000 live births) 2010-2015 3.6Fertility rate, total (live births per woman) 2010-2015 1.8Contraceptive prevalence (ages 15-49, %) n 2006-2012 69.0International migrant stock (000 and % of total population) mid-2013 1 964.9/11.7Refugees and others of concern to UNHCR mid-2013 84 334 opEducation: Government expenditure (% of GDP) 2006-2012 6.0Education: Primary-secondary gross enrolment ratio (f/m per 100) 2006-2012 117.4/118.7Education: Female third-level students (% of total) 2006-2012 51.8Intentional homicides (females and males, per 100 000) 2008-2010 0.5/1.4Seats held by women in national parliaments (%) 2014 38.7Environmental indicatorsThreatened species 2013 30Forested area (% of land area) 2011 10.8CO 2 emission estimates (000 metric tons and metric tons per capita) 2010 181 929/11.0Energy consumption per capita (kilograms oil equivalent) i 2010 3 946.0Precipitation in the capital city, total mean (millimetres)780 qTemperature in the capital city, mean °C (minimum and maximum)6.1/13.4 qa Amsterdam is the capital and The Hague is the seat of government. b Market rate. c Age group 15 to74 years. d Break in series; data not strictly comparable. e European Labour Force Survey (Eurostat). fThe indices are shown in terms of ISIC Rev.3. g 2011. h Arrivals of non-resident tourists in all types ofaccommodation establishments. i Excludes Suriname and the Netherlands Antilles. j July. k Third quarter.l Age group 16 to 74 years using the Internet within the last 12 months. m Age group 16 to 74 years. nAge group 18 to 45 years. o Refugee population refers to the end of 2012. p Asylum-seeker populationrefers to the end of 2011. q Based on monthly averages for the period 1971-2000.138 World Statistics Pocketbook