

STATISTICS
c2drS
c2drS
- No tags were found...

Create successful ePaper yourself
Turn your PDF publications into a flip-book with our unique Google optimized e-Paper software.
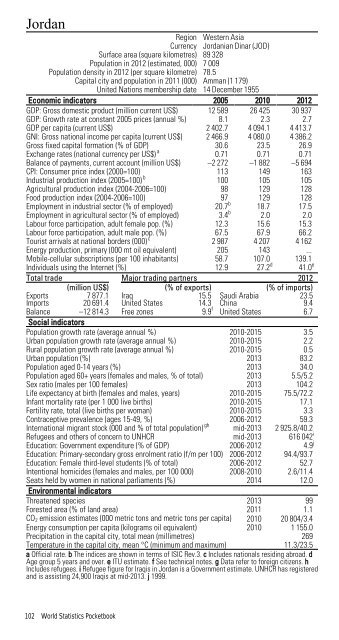
JordanRegion Western AsiaCurrency Jordanian Dinar (JOD)Surface area (square kilometres) 89 328Population in 2012 (estimated, 000) 7 009Population density in 2012 (per square kilometre) 78.5Capital city and population in 2011 (000) Amman (1 179)United Nations membership date 14 December 1955Economic indicators 2005 2010 2012GDP: Gross domestic product (million current US$) 12 589 26 425 30 937GDP: Growth rate at constant 2005 prices (annual %) 8.1 2.3 2.7GDP per capita (current US$) 2 402.7 4 094.1 4 413.7GNI: Gross national income per capita (current US$) 2 466.9 4 080.0 4 386.2Gross fixed capital formation (% of GDP) 30.6 23.5 26.9Exchange rates (national currency per US$) a 0.71 0.71 0.71Balance of payments, current account (million US$) –2 272 –1 882 –5 694CPI: Consumer price index (2000=100) 113 149 163Industrial production index (2005=100) b 100 105 105Agricultural production index (2004-2006=100) 98 129 128Food production index (2004-2006=100) 97 129 128Employment in industrial sector (% of employed) 20.7 b 18.7 17.5Employment in agricultural sector (% of employed) 3.4 b 2.0 2.0Labour force participation, adult female pop. (%) 12.3 15.6 15.3Labour force participation, adult male pop. (%) 67.5 67.9 66.2Tourist arrivals at national borders (000) c 2 987 4 207 4 162Energy production, primary (000 mt oil equivalent) 205 143 ...Mobile-cellular subscriptions (per 100 inhabitants) 58.7 107.0 139.1Individuals using the Internet (%) 12.9 27.2 d 41.0 eTotal trade Major trading partners 2012(million US$) (% of exports) (% of imports)ExportsImports7 877.120 691.4IraqUnited States15.514.3Saudi ArabiaChina23.59.4Balance –12 814.3 Free zones 9.9 f United States 6.7Social indicatorsPopulation growth rate (average annual %) 2010-2015 3.5Urban population growth rate (average annual %) 2010-2015 2.2Rural population growth rate (average annual %) 2010-2015 0.5Urban population (%) 2013 83.2Population aged 0-14 years (%) 2013 34.0Population aged 60+ years (females and males, % of total) 2013 5.5/5.2Sex ratio (males per 100 females) 2013 104.2Life expectancy at birth (females and males, years) 2010-2015 75.5/72.2Infant mortality rate (per 1 000 live births) 2010-2015 17.1Fertility rate, total (live births per woman) 2010-2015 3.3Contraceptive prevalence (ages 15-49, %) 2006-2012 59.3International migrant stock (000 and % of total population) gh mid-2013 2 925.8/40.2Refugees and others of concern to UNHCR mid-2013 616 042 iEducation: Government expenditure (% of GDP) 2006-2012 4.9 jEducation: Primary-secondary gross enrolment ratio (f/m per 100) 2006-2012 94.4/93.7Education: Female third-level students (% of total) 2006-2012 52.7Intentional homicides (females and males, per 100 000) 2008-2010 2.6/11.4Seats held by women in national parliaments (%) 2014 12.0Environmental indicatorsThreatened species 2013 99Forested area (% of land area) 2011 1.1CO 2 emission estimates (000 metric tons and metric tons per capita) 2010 20 804/3.4Energy consumption per capita (kilograms oil equivalent) 2010 1 155.0Precipitation in the capital city, total mean (millimetres) 269Temperature in the capital city, mean °C (minimum and maximum) 11.3/23.5a Official rate. b The indices are shown in terms of ISIC Rev.3. c Includes nationals residing abroad. dAge group 5 years and over. e ITU estimate. f See technical notes. g Data refer to foreign citizens. hIncludes refugees. i Refugee figure for Iraqis in Jordan is a Government estimate. UNHCR has registeredand is assisting 24,900 Iraqis at mid-2013. j 1999.102 World Statistics Pocketbook