

STATISTICS
c2drS
c2drS
- No tags were found...

Create successful ePaper yourself
Turn your PDF publications into a flip-book with our unique Google optimized e-Paper software.
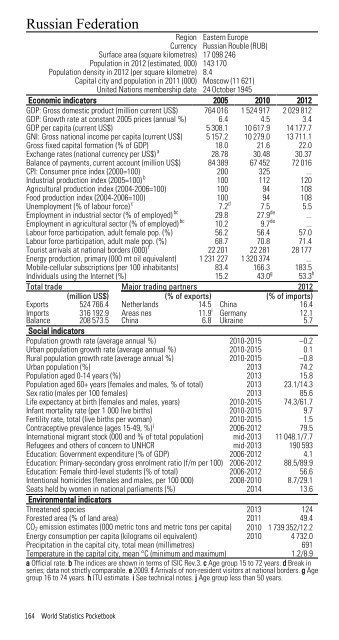
Russian FederationRegion Eastern EuropeCurrency Russian Rouble (RUB)Surface area (square kilometres) 17 098 246Population in 2012 (estimated, 000) 143 170Population density in 2012 (per square kilometre) 8.4Capital city and population in 2011 (000) Moscow (11 621)United Nations membership date 24 October 1945Economic indicators 2005 2010 2012GDP: Gross domestic product (million current US$) 764 016 1 524 917 2 029 812GDP: Growth rate at constant 2005 prices (annual %) 6.4 4.5 3.4GDP per capita (current US$) 5 308.1 10 617.9 14 177.7GNI: Gross national income per capita (current US$) 5 157.2 10 279.0 13 711.1Gross fixed capital formation (% of GDP) 18.0 21.6 22.0Exchange rates (national currency per US$) a 28.78 30.48 30.37Balance of payments, current account (million US$) 84 389 67 452 72 016CPI: Consumer price index (2000=100) 200 325 ...Industrial production index (2005=100) b 100 112 120Agricultural production index (2004-2006=100) 100 94 108Food production index (2004-2006=100) 100 94 108Unemployment (% of labour force) c 7.2 d 7.5 5.5Employment in industrial sector (% of employed) bc 29.8 27.9 de ...Employment in agricultural sector (% of employed) bc 10.2 9.7 de ...Labour force participation, adult female pop. (%) 56.2 56.4 57.0Labour force participation, adult male pop. (%) 68.7 70.8 71.4Tourist arrivals at national borders (000) f 22 201 22 281 28 177Energy production, primary (000 mt oil equivalent) 1 231 227 1 320 374 ...Mobile-cellular subscriptions (per 100 inhabitants) 83.4 166.3 183.5Individuals using the Internet (%) 15.2 43.0 g 53.3 hTotal trade Major trading partners 2012(million US$) (% of exports) (% of imports)Exports 524 766.4 Netherlands 14.5 China 16.4ImportsBalance316 192.9208 573.5Areas nesChina11.9 i6.8GermanyUkraine12.15.7Social indicatorsPopulation growth rate (average annual %) 2010-2015 –0.2Urban population growth rate (average annual %) 2010-2015 0.1Rural population growth rate (average annual %) 2010-2015 –0.8Urban population (%) 2013 74.2Population aged 0-14 years (%) 2013 15.8Population aged 60+ years (females and males, % of total) 2013 23.1/14.3Sex ratio (males per 100 females) 2013 85.6Life expectancy at birth (females and males, years) 2010-2015 74.3/61.7Infant mortality rate (per 1 000 live births) 2010-2015 9.7Fertility rate, total (live births per woman) 2010-2015 1.5Contraceptive prevalence (ages 15-49, %) j 2006-2012 79.5International migrant stock (000 and % of total population) mid-2013 11 048.1/7.7Refugees and others of concern to UNHCR mid-2013 190 593Education: Government expenditure (% of GDP) 2006-2012 4.1Education: Primary-secondary gross enrolment ratio (f/m per 100) 2006-2012 88.5/89.9Education: Female third-level students (% of total) 2006-2012 56.6Intentional homicides (females and males, per 100 000) 2008-2010 8.7/29.1Seats held by women in national parliaments (%) 2014 13.6Environmental indicatorsThreatened species 2013 124Forested area (% of land area) 2011 49.4CO 2 emission estimates (000 metric tons and metric tons per capita) 2010 1 739 352/12.2Energy consumption per capita (kilograms oil equivalent) 2010 4 732.0Precipitation in the capital city, total mean (millimetres) 691Temperature in the capital city, mean °C (minimum and maximum) 1.2/8.9a Official rate. b The indices are shown in terms of ISIC Rev.3. c Age group 15 to 72 years. d Break inseries; data not strictly comparable. e 2009. f Arrivals of non-resident visitors at national borders. g Agegroup 16 to 74 years. h ITU estimate. i See technical notes. j Age group less than 50 years.164 World Statistics Pocketbook