

STATISTICS
c2drS
c2drS
- No tags were found...

You also want an ePaper? Increase the reach of your titles
YUMPU automatically turns print PDFs into web optimized ePapers that Google loves.
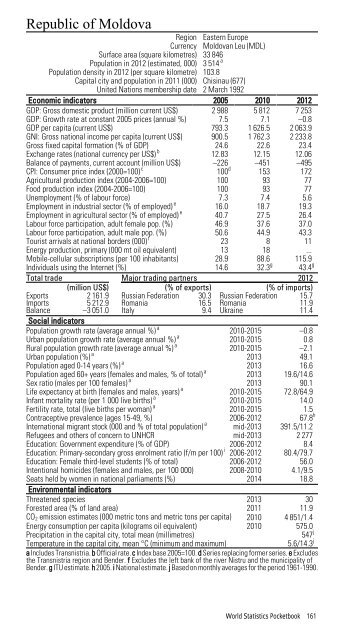
Republic of MoldovaRegion Eastern EuropeCurrency Moldovan Leu (MDL)Surface area (square kilometres) 33 846Population in 2012 (estimated, 000) 3 514 aPopulation density in 2012 (per square kilometre) 103.8Capital city and population in 2011 (000) Chisinau (677)United Nations membership date 2 March 1992Economic indicators 2005 2010 2012GDP: Gross domestic product (million current US$) 2 988 5 812 7 253GDP: Growth rate at constant 2005 prices (annual %) 7.5 7.1 –0.8GDP per capita (current US$) 793.3 1 626.5 2 063.9GNI: Gross national income per capita (current US$) 900.5 1 762.3 2 233.8Gross fixed capital formation (% of GDP) 24.6 22.6 23.4Exchange rates (national currency per US$) b 12.83 12.15 12.06Balance of payments, current account (million US$) –226 –451 –495CPI: Consumer price index (2000=100) c 100 d 153 172Agricultural production index (2004-2006=100) 100 93 77Food production index (2004-2006=100) 100 93 77Unemployment (% of labour force) 7.3 7.4 5.6Employment in industrial sector (% of employed) e 16.0 18.7 19.3Employment in agricultural sector (% of employed) e 40.7 27.5 26.4Labour force participation, adult female pop. (%) 46.9 37.6 37.0Labour force participation, adult male pop. (%) 50.6 44.9 43.3Tourist arrivals at national borders (000) f 23 8 11Energy production, primary (000 mt oil equivalent) 13 18 ...Mobile-cellular subscriptions (per 100 inhabitants) 28.9 88.6 115.9Individuals using the Internet (%) 14.6 32.3 g 43.4 gTotal trade Major trading partners 2012(million US$) (% of exports) (% of imports)Exports 2 161.9 Russian Federation 30.3 Russian Federation 15.7Imports 5 212.9 Romania 16.5 Romania 11.9Balance –3 051.0 Italy 9.4 Ukraine 11.4Social indicatorsPopulation growth rate (average annual %) a 2010-2015 –0.8Urban population growth rate (average annual %) a 2010-2015 0.8Rural population growth rate (average annual %) a 2010-2015 –2.1Urban population (%) a 2013 49.1Population aged 0-14 years (%) a 2013 16.6Population aged 60+ years (females and males, % of total) a 2013 19.6/14.6Sex ratio (males per 100 females) a 2013 90.1Life expectancy at birth (females and males, years) a 2010-2015 72.8/64.9Infant mortality rate (per 1 000 live births) a 2010-2015 14.0Fertility rate, total (live births per woman) a 2010-2015 1.5Contraceptive prevalence (ages 15-49, %) 2006-2012 67.8 hInternational migrant stock (000 and % of total population) a mid-2013 391.5/11.2Refugees and others of concern to UNHCR mid-2013 2 277Education: Government expenditure (% of GDP) 2006-2012 8.4Education: Primary-secondary gross enrolment ratio (f/m per 100) i 2006-2012 80.4/79.7Education: Female third-level students (% of total) 2006-2012 56.0Intentional homicides (females and males, per 100 000) 2008-2010 4.1/9.5Seats held by women in national parliaments (%) 2014 18.8Environmental indicatorsThreatened species 2013 30Forested area (% of land area) 2011 11.9CO 2 emission estimates (000 metric tons and metric tons per capita) 2010 4 851/1.4Energy consumption per capita (kilograms oil equivalent) 2010 575.0Precipitation in the capital city, total mean (millimetres)547 jTemperature in the capital city, mean °C (minimum and maximum)5.6/14.3 ja Includes Transnistria. b Official rate. c Index base 2005=100. d Series replacing former series. e Excludesthe Transnistria region and Bender. f Excludes the left bank of the river Nistru and the municipality ofBender. g ITU estimate. h 2005. i National estimate. j Based on monthly averages for the period 1961-1990.World Statistics Pocketbook 161