

STATISTICS
c2drS
c2drS
- No tags were found...

Create successful ePaper yourself
Turn your PDF publications into a flip-book with our unique Google optimized e-Paper software.
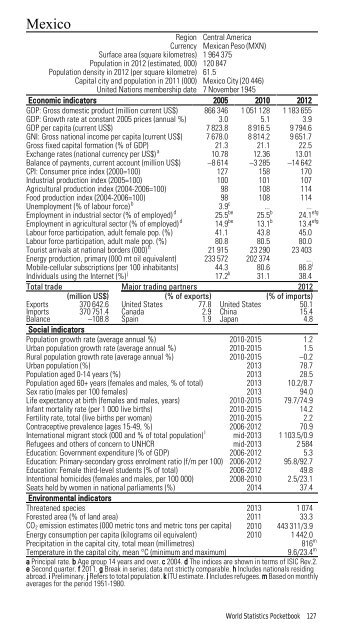
MexicoRegion Central AmericaCurrency Mexican Peso (MXN)Surface area (square kilometres) 1 964 375Population in 2012 (estimated, 000) 120 847Population density in 2012 (per square kilometre) 61.5Capital city and population in 2011 (000) Mexico City (20 446)United Nations membership date 7 November 1945Economic indicators 2005 2010 2012GDP: Gross domestic product (million current US$) 866 346 1 051 128 1 183 655GDP: Growth rate at constant 2005 prices (annual %) 3.0 5.1 3.9GDP per capita (current US$) 7 823.8 8 916.5 9 794.6GNI: Gross national income per capita (current US$) 7 678.0 8 814.2 9 651.7Gross fixed capital formation (% of GDP) 21.3 21.1 22.5Exchange rates (national currency per US$) a 10.78 12.36 13.01Balance of payments, current account (million US$) –8 614 –3 285 –14 642CPI: Consumer price index (2000=100) 127 158 170Industrial production index (2005=100) 100 101 107Agricultural production index (2004-2006=100) 98 108 114Food production index (2004-2006=100) 98 108 114Unemployment (% of labour force) b 3.9 c ... ...Employment in industrial sector (% of employed) d 25.5 be 25.5 b 24.1 efgEmployment in agricultural sector (% of employed) d 14.9 be 13.1 b 13.4 efgLabour force participation, adult female pop. (%) 41.1 43.8 45.0Labour force participation, adult male pop. (%) 80.8 80.5 80.0Tourist arrivals at national borders (000) h 21 915 23 290 23 403Energy production, primary (000 mt oil equivalent) 233 572 202 374 ...Mobile-cellular subscriptions (per 100 inhabitants) 44.3 80.6 86.8 iIndividuals using the Internet (%) j 17.2 k 31.1 38.4Total trade Major trading partners 2012(million US$) (% of exports) (% of imports)Exports 370 642.6 United States 77.8 United States 50.1Imports 370 751.4 Canada 2.9 China 15.4Balance –108.8 Spain 1.9 Japan 4.8Social indicatorsPopulation growth rate (average annual %) 2010-2015 1.2Urban population growth rate (average annual %) 2010-2015 1.5Rural population growth rate (average annual %) 2010-2015 –0.2Urban population (%) 2013 78.7Population aged 0-14 years (%) 2013 28.5Population aged 60+ years (females and males, % of total) 2013 10.2/8.7Sex ratio (males per 100 females) 2013 94.0Life expectancy at birth (females and males, years) 2010-2015 79.7/74.9Infant mortality rate (per 1 000 live births) 2010-2015 14.2Fertility rate, total (live births per woman) 2010-2015 2.2Contraceptive prevalence (ages 15-49, %) 2006-2012 70.9International migrant stock (000 and % of total population) l mid-2013 1 103.5/0.9Refugees and others of concern to UNHCR mid-2013 2 584Education: Government expenditure (% of GDP) 2006-2012 5.3Education: Primary-secondary gross enrolment ratio (f/m per 100) 2006-2012 95.8/92.7Education: Female third-level students (% of total) 2006-2012 49.8Intentional homicides (females and males, per 100 000) 2008-2010 2.5/23.1Seats held by women in national parliaments (%) 2014 37.4Environmental indicatorsThreatened species 2013 1 074Forested area (% of land area) 2011 33.3CO 2 emission estimates (000 metric tons and metric tons per capita) 2010 443 311/3.9Energy consumption per capita (kilograms oil equivalent) 2010 1 442.0Precipitation in the capital city, total mean (millimetres)816 mTemperature in the capital city, mean °C (minimum and maximum)9.6/23.4 ma Principal rate. b Age group 14 years and over. c 2004. d The indices are shown in terms of ISIC Rev.2.e Second quarter. f 2011. g Break in series; data not strictly comparable. h Includes nationals residingabroad. i Preliminary. j Refers to total population. k ITU estimate. l Includes refugees. m Based on monthlyaverages for the period 1951-1980.World Statistics Pocketbook 127