

STATISTICS
c2drS
c2drS
- No tags were found...

Create successful ePaper yourself
Turn your PDF publications into a flip-book with our unique Google optimized e-Paper software.
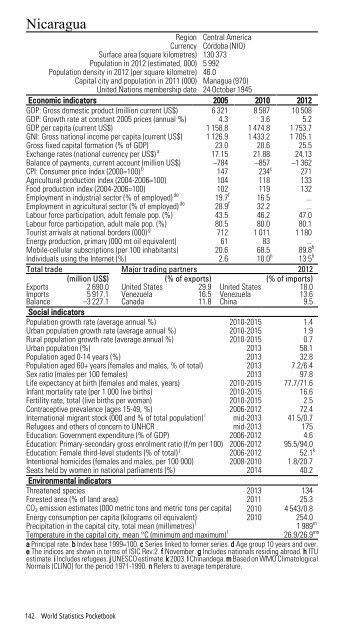
NicaraguaRegion Central AmericaCurrency Córdoba (NIO)Surface area (square kilometres) 130 373Population in 2012 (estimated, 000) 5 992Population density in 2012 (per square kilometre) 46.0Capital city and population in 2011 (000) Managua (970)United Nations membership date 24 October 1945Economic indicators 2005 2010 2012GDP: Gross domestic product (million current US$) 6 321 8 587 10 508GDP: Growth rate at constant 2005 prices (annual %) 4.3 3.6 5.2GDP per capita (current US$) 1 158.8 1 474.8 1 753.7GNI: Gross national income per capita (current US$) 1 126.9 1 433.2 1 705.1Gross fixed capital formation (% of GDP) 23.0 20.6 25.5Exchange rates (national currency per US$) a 17.15 21.88 24.13Balance of payments, current account (million US$) –784 –857 –1 362CPI: Consumer price index (2000=100) b 147 234 c 271Agricultural production index (2004-2006=100) 104 118 133Food production index (2004-2006=100) 102 119 132Employment in industrial sector (% of employed) de 19.7 f 16.5 ...Employment in agricultural sector (% of employed) de 28.9 f 32.2 ...Labour force participation, adult female pop. (%) 43.5 46.2 47.0Labour force participation, adult male pop. (%) 80.5 80.0 80.1Tourist arrivals at national borders (000) g 712 1 011 1 180Energy production, primary (000 mt oil equivalent) 61 83 ...Mobile-cellular subscriptions (per 100 inhabitants) 20.6 68.5 89.8 hIndividuals using the Internet (%) 2.6 10.0 h 13.5 hTotal trade Major trading partners 2012(million US$) (% of exports) (% of imports)Exports 2 690.0 United States 29.9 United States 18.0Imports 5 917.1 Venezuela 16.5 Venezuela 13.6Balance –3 227.1 Canada 11.8 China 9.5Social indicatorsPopulation growth rate (average annual %) 2010-2015 1.4Urban population growth rate (average annual %) 2010-2015 1.9Rural population growth rate (average annual %) 2010-2015 0.7Urban population (%) 2013 58.1Population aged 0-14 years (%) 2013 32.8Population aged 60+ years (females and males, % of total) 2013 7.2/6.4Sex ratio (males per 100 females) 2013 97.8Life expectancy at birth (females and males, years) 2010-2015 77.7/71.6Infant mortality rate (per 1 000 live births) 2010-2015 16.6Fertility rate, total (live births per woman) 2010-2015 2.5Contraceptive prevalence (ages 15-49, %) 2006-2012 72.4International migrant stock (000 and % of total population) i mid-2013 41.5/0.7Refugees and others of concern to UNHCR mid-2013 175Education: Government expenditure (% of GDP) 2006-2012 4.6Education: Primary-secondary gross enrolment ratio (f/m per 100) 2006-2012 95.5/94.0Education: Female third-level students (% of total) j 2006-2012 52.1 kIntentional homicides (females and males, per 100 000) 2008-2010 1.8/20.7Seats held by women in national parliaments (%) 2014 40.2Environmental indicatorsThreatened species 2013 134Forested area (% of land area) 2011 25.3CO 2 emission estimates (000 metric tons and metric tons per capita) 2010 4 543/0.8Energy consumption per capita (kilograms oil equivalent) 2010 254.0Precipitation in the capital city, total mean (millimetres) l1 989 mTemperature in the capital city, mean °C (minimum and maximum) l26.9/26.9 mna Principal rate. b Index base 1999=100. c Series linked to former series. d Age group 10 years and over.e The indices are shown in terms of ISIC Rev.2. f November. g Includes nationals residing abroad. h ITUestimate. i Includes refugees. j UNESCO estimate. k 2003. l Chinandega. m Based on WMO ClimatologicalNormals (CLINO) for the period 1971-1990. n Refers to average temperature.142 World Statistics Pocketbook