

STATISTICS
c2drS
c2drS
- No tags were found...

You also want an ePaper? Increase the reach of your titles
YUMPU automatically turns print PDFs into web optimized ePapers that Google loves.
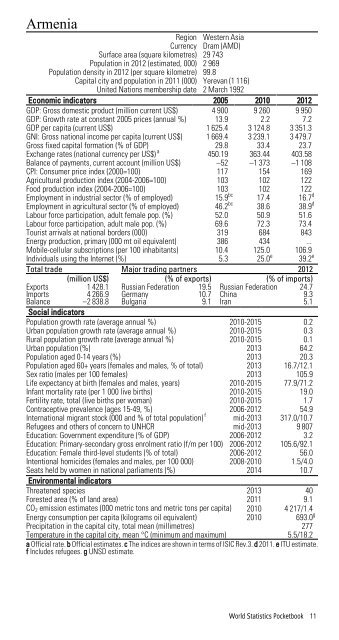
ArmeniaRegion Western AsiaCurrency Dram (AMD)Surface area (square kilometres) 29 743Population in 2012 (estimated, 000) 2 969Population density in 2012 (per square kilometre) 99.8Capital city and population in 2011 (000) Yerevan (1 116)United Nations membership date 2 March 1992Economic indicators 2005 2010 2012GDP: Gross domestic product (million current US$) 4 900 9 260 9 950GDP: Growth rate at constant 2005 prices (annual %) 13.9 2.2 7.2GDP per capita (current US$) 1 625.4 3 124.8 3 351.3GNI: Gross national income per capita (current US$) 1 669.4 3 239.1 3 479.7Gross fixed capital formation (% of GDP) 29.8 33.4 23.7Exchange rates (national currency per US$) a 450.19 363.44 403.58Balance of payments, current account (million US$) –52 –1 373 –1 108CPI: Consumer price index (2000=100) 117 154 169Agricultural production index (2004-2006=100) 103 102 122Food production index (2004-2006=100) 103 102 122Employment in industrial sector (% of employed) 15.9 bc 17.4 16.7 dEmployment in agricultural sector (% of employed) 46.2 bc 38.6 38.9 dLabour force participation, adult female pop. (%) 52.0 50.9 51.6Labour force participation, adult male pop. (%) 69.6 72.3 73.4Tourist arrivals at national borders (000) 319 684 843Energy production, primary (000 mt oil equivalent) 386 434 ...Mobile-cellular subscriptions (per 100 inhabitants) 10.4 125.0 106.9Individuals using the Internet (%) 5.3 25.0 e 39.2 eTotal trade Major trading partners 2012(million US$) (% of exports) (% of imports)Exports 1 428.1 Russian Federation 19.5 Russian Federation 24.7Imports 4 266.9 Germany 10.7 China 9.3Balance –2 838.8 Bulgaria 9.1 Iran 5.1Social indicatorsPopulation growth rate (average annual %) 2010-2015 0.2Urban population growth rate (average annual %) 2010-2015 0.3Rural population growth rate (average annual %) 2010-2015 0.1Urban population (%) 2013 64.2Population aged 0-14 years (%) 2013 20.3Population aged 60+ years (females and males, % of total) 2013 16.7/12.1Sex ratio (males per 100 females) 2013 105.9Life expectancy at birth (females and males, years) 2010-2015 77.9/71.2Infant mortality rate (per 1 000 live births) 2010-2015 19.0Fertility rate, total (live births per woman) 2010-2015 1.7Contraceptive prevalence (ages 15-49, %) 2006-2012 54.9International migrant stock (000 and % of total population) f mid-2013 317.0/10.7Refugees and others of concern to UNHCR mid-2013 9 807Education: Government expenditure (% of GDP) 2006-2012 3.2Education: Primary-secondary gross enrolment ratio (f/m per 100) 2006-2012 105.6/92.1Education: Female third-level students (% of total) 2006-2012 56.0Intentional homicides (females and males, per 100 000) 2008-2010 1.5/4.0Seats held by women in national parliaments (%) 2014 10.7Environmental indicatorsThreatened species 2013 40Forested area (% of land area) 2011 9.1CO 2 emission estimates (000 metric tons and metric tons per capita) 2010 4 217/1.4Energy consumption per capita (kilograms oil equivalent) 2010 693.0 gPrecipitation in the capital city, total mean (millimetres) 277Temperature in the capital city, mean °C (minimum and maximum) 5.5/18.2a Official rate. b Official estimates. c The indices are shown in terms of ISIC Rev.3. d 2011. e ITU estimate.f Includes refugees. g UNSD estimate.World Statistics Pocketbook 11