

STATISTICS
c2drS
c2drS
- No tags were found...

Create successful ePaper yourself
Turn your PDF publications into a flip-book with our unique Google optimized e-Paper software.
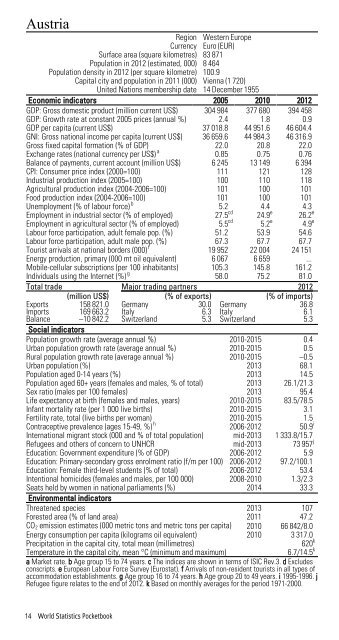
AustriaRegion Western EuropeCurrency Euro (EUR)Surface area (square kilometres) 83 871Population in 2012 (estimated, 000) 8 464Population density in 2012 (per square kilometre) 100.9Capital city and population in 2011 (000) Vienna (1 720)United Nations membership date 14 December 1955Economic indicators 2005 2010 2012GDP: Gross domestic product (million current US$) 304 984 377 680 394 458GDP: Growth rate at constant 2005 prices (annual %) 2.4 1.8 0.9GDP per capita (current US$) 37 018.8 44 951.6 46 604.4GNI: Gross national income per capita (current US$) 36 659.6 44 984.3 46 316.9Gross fixed capital formation (% of GDP) 22.0 20.8 22.0Exchange rates (national currency per US$) a 0.85 0.75 0.76Balance of payments, current account (million US$) 6 245 13 149 6 394CPI: Consumer price index (2000=100) 111 121 128Industrial production index (2005=100) 100 110 118Agricultural production index (2004-2006=100) 101 100 101Food production index (2004-2006=100) 101 100 101Unemployment (% of labour force) b 5.2 4.4 4.3Employment in industrial sector (% of employed) 27.5 cd 24.9 e 26.2 eEmployment in agricultural sector (% of employed) 5.5 cd 5.2 e 4.9 eLabour force participation, adult female pop. (%) 51.2 53.9 54.6Labour force participation, adult male pop. (%) 67.3 67.7 67.7Tourist arrivals at national borders (000) f 19 952 22 004 24 151Energy production, primary (000 mt oil equivalent) 6 067 6 659 ...Mobile-cellular subscriptions (per 100 inhabitants) 105.3 145.8 161.2Individuals using the Internet (%) g 58.0 75.2 81.0Total trade Major trading partners 2012(million US$) (% of exports) (% of imports)Exports 158 821.0 Germany 30.0 Germany 36.8Imports 169 663.2 Italy 6.3 Italy 6.1Balance –10 842.2 Switzerland 5.3 Switzerland 5.3Social indicatorsPopulation growth rate (average annual %) 2010-2015 0.4Urban population growth rate (average annual %) 2010-2015 0.5Rural population growth rate (average annual %) 2010-2015 –0.5Urban population (%) 2013 68.1Population aged 0-14 years (%) 2013 14.5Population aged 60+ years (females and males, % of total) 2013 26.1/21.3Sex ratio (males per 100 females) 2013 95.4Life expectancy at birth (females and males, years) 2010-2015 83.5/78.5Infant mortality rate (per 1 000 live births) 2010-2015 3.1Fertility rate, total (live births per woman) 2010-2015 1.5Contraceptive prevalence (ages 15-49, %) h 2006-2012 50.9 iInternational migrant stock (000 and % of total population) mid-2013 1 333.8/15.7Refugees and others of concern to UNHCR mid-2013 73 957 jEducation: Government expenditure (% of GDP) 2006-2012 5.9Education: Primary-secondary gross enrolment ratio (f/m per 100) 2006-2012 97.2/100.1Education: Female third-level students (% of total) 2006-2012 53.4Intentional homicides (females and males, per 100 000) 2008-2010 1.3/2.3Seats held by women in national parliaments (%) 2014 33.3Environmental indicatorsThreatened species 2013 107Forested area (% of land area) 2011 47.2CO 2 emission estimates (000 metric tons and metric tons per capita) 2010 66 842/8.0Energy consumption per capita (kilograms oil equivalent) 2010 3 317.0Precipitation in the capital city, total mean (millimetres)620 kTemperature in the capital city, mean °C (minimum and maximum)6.7/14.5 ka Market rate. b Age group 15 to 74 years. c The indices are shown in terms of ISIC Rev.3. d Excludesconscripts. e European Labour Force Survey (Eurostat). f Arrivals of non-resident tourists in all types ofaccommodation establishments. g Age group 16 to 74 years. h Age group 20 to 49 years. i 1995-1996. jRefugee figure relates to the end of 2012. k Based on monthly averages for the period 1971-2000.14 World Statistics Pocketbook