

STATISTICS
c2drS
c2drS
- No tags were found...

Create successful ePaper yourself
Turn your PDF publications into a flip-book with our unique Google optimized e-Paper software.
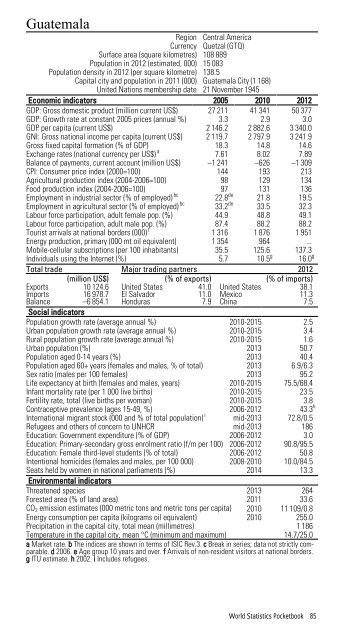
GuatemalaRegion Central AmericaCurrency Quetzal (GTQ)Surface area (square kilometres) 108 889Population in 2012 (estimated, 000) 15 083Population density in 2012 (per square kilometre) 138.5Capital city and population in 2011 (000) Guatemala City (1 168)United Nations membership date 21 November 1945Economic indicators 2005 2010 2012GDP: Gross domestic product (million current US$) 27 211 41 341 50 377GDP: Growth rate at constant 2005 prices (annual %) 3.3 2.9 3.0GDP per capita (current US$) 2 146.2 2 882.6 3 340.0GNI: Gross national income per capita (current US$) 2 119.7 2 797.9 3 241.9Gross fixed capital formation (% of GDP) 18.3 14.8 14.6Exchange rates (national currency per US$) a 7.61 8.02 7.89Balance of payments, current account (million US$) –1 241 –626 –1 309CPI: Consumer price index (2000=100) 144 193 213Agricultural production index (2004-2006=100) 98 129 134Food production index (2004-2006=100) 97 131 136Employment in industrial sector (% of employed) bc 22.8 de 21.8 19.5Employment in agricultural sector (% of employed) bc 33.2 de 33.5 32.3Labour force participation, adult female pop. (%) 44.9 48.8 49.1Labour force participation, adult male pop. (%) 87.4 88.2 88.2Tourist arrivals at national borders (000) f 1 316 1 876 1 951Energy production, primary (000 mt oil equivalent) 1 354 964 ...Mobile-cellular subscriptions (per 100 inhabitants) 35.5 125.6 137.3Individuals using the Internet (%) 5.7 10.5 g 16.0 gTotal trade Major trading partners 2012(million US$) (% of exports) (% of imports)Exports 10 124.6 United States 41.0 United States 38.1Imports 16 978.7 El Salvador 11.0 Mexico 11.3Balance –6 854.1 Honduras 7.9 China 7.5Social indicatorsPopulation growth rate (average annual %) 2010-2015 2.5Urban population growth rate (average annual %) 2010-2015 3.4Rural population growth rate (average annual %) 2010-2015 1.6Urban population (%) 2013 50.7Population aged 0-14 years (%) 2013 40.4Population aged 60+ years (females and males, % of total) 2013 6.9/6.3Sex ratio (males per 100 females) 2013 95.2Life expectancy at birth (females and males, years) 2010-2015 75.5/68.4Infant mortality rate (per 1 000 live births) 2010-2015 23.5Fertility rate, total (live births per woman) 2010-2015 3.8Contraceptive prevalence (ages 15-49, %) 2006-2012 43.3 hInternational migrant stock (000 and % of total population) i mid-2013 72.8/0.5Refugees and others of concern to UNHCR mid-2013 186Education: Government expenditure (% of GDP) 2006-2012 3.0Education: Primary-secondary gross enrolment ratio (f/m per 100) 2006-2012 90.8/95.5Education: Female third-level students (% of total) 2006-2012 50.8Intentional homicides (females and males, per 100 000) 2008-2010 10.0/84.5Seats held by women in national parliaments (%) 2014 13.3Environmental indicatorsThreatened species 2013 264Forested area (% of land area) 2011 33.6CO 2 emission estimates (000 metric tons and metric tons per capita) 2010 11 109/0.8Energy consumption per capita (kilograms oil equivalent) 2010 255.0Precipitation in the capital city, total mean (millimetres) 1 186Temperature in the capital city, mean °C (minimum and maximum) 14.7/25.0a Market rate. b The indices are shown in terms of ISIC Rev.3. c Break in series; data not strictly comparable.d 2006. e Age group 10 years and over. f Arrivals of non-resident visitors at national borders.g ITU estimate. h 2002. i Includes refugees.World Statistics Pocketbook 85