

STATISTICS
c2drS
c2drS
- No tags were found...

Create successful ePaper yourself
Turn your PDF publications into a flip-book with our unique Google optimized e-Paper software.
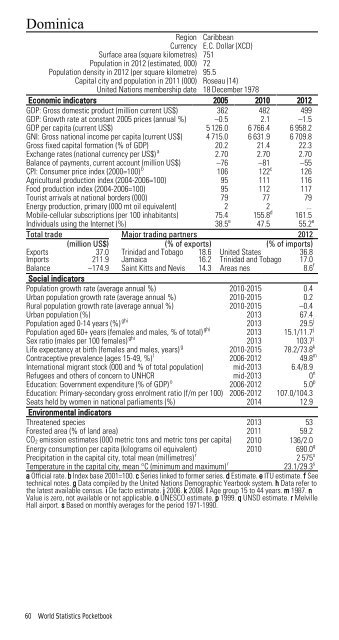
DominicaRegion CaribbeanCurrency E.C. Dollar (XCD)Surface area (square kilometres) 751Population in 2012 (estimated, 000) 72Population density in 2012 (per square kilometre) 95.5Capital city and population in 2011 (000) Roseau (14)United Nations membership date 18 December 1978Economic indicators 2005 2010 2012GDP: Gross domestic product (million current US$) 362 482 499GDP: Growth rate at constant 2005 prices (annual %) –0.5 2.1 –1.5GDP per capita (current US$) 5 126.0 6 766.4 6 958.2GNI: Gross national income per capita (current US$) 4 715.0 6 631.9 6 709.8Gross fixed capital formation (% of GDP) 20.2 21.4 22.3Exchange rates (national currency per US$) a 2.70 2.70 2.70Balance of payments, current account (million US$) –76 –81 –55CPI: Consumer price index (2000=100) b 106 122 c 126Agricultural production index (2004-2006=100) 95 111 116Food production index (2004-2006=100) 95 112 117Tourist arrivals at national borders (000) 79 77 79Energy production, primary (000 mt oil equivalent) 2 2 ...Mobile-cellular subscriptions (per 100 inhabitants) 75.4 155.8 d 161.5Individuals using the Internet (%) 38.5 e 47.5 55.2 eTotal trade Major trading partners 2012(million US$) (% of exports) (% of imports)ExportsImports37.0211.9Trinidad and TobagoJamaica18.616.2United StatesTrinidad and Tobago36.817.0Balance –174.9 Saint Kitts and Nevis 14.3 Areas nes 8.6 fSocial indicatorsPopulation growth rate (average annual %) 2010-2015 0.4Urban population growth rate (average annual %) 2010-2015 0.2Rural population growth rate (average annual %) 2010-2015 –0.4Urban population (%) 2013 67.4Population aged 0-14 years (%) ghi 2013 29.5 jPopulation aged 60+ years (females and males, % of total) ghi 2013 15.1/11.7 jSex ratio (males per 100 females) ghi 2013 103.7 jLife expectancy at birth (females and males, years) g 2010-2015 78.2/73.8 kContraceptive prevalence (ages 15-49, %) l 2006-2012 49.8 mInternational migrant stock (000 and % of total population) mid-2013 6.4/8.9Refugees and others of concern to UNHCR mid-2013 0 nEducation: Government expenditure (% of GDP) o 2006-2012 5.0 pEducation: Primary-secondary gross enrolment ratio (f/m per 100) 2006-2012 107.0/104.3Seats held by women in national parliaments (%) 2014 12.9Environmental indicatorsThreatened species 2013 53Forested area (% of land area) 2011 59.2CO 2 emission estimates (000 metric tons and metric tons per capita) 2010 136/2.0Energy consumption per capita (kilograms oil equivalent) 2010 690.0 qPrecipitation in the capital city, total mean (millimetres) r2 575 sTemperature in the capital city, mean °C (minimum and maximum) r23.1/29.3 sa Official rate. b Index base 2001=100. c Series linked to former series. d Estimate. e ITU estimate. f Seetechnical notes. g Data compiled by the United Nations Demographic Yearbook system. h Data refer tothe latest available census. i De facto estimate. j 2006. k 2008. l Age group 15 to 44 years. m 1987. nValue is zero, not available or not applicable. o UNESCO estimate. p 1999. q UNSD estimate. r MelvilleHall airport. s Based on monthly averages for the period 1971-1990.60 World Statistics Pocketbook