

STATISTICS
c2drS
c2drS
- No tags were found...

Create successful ePaper yourself
Turn your PDF publications into a flip-book with our unique Google optimized e-Paper software.
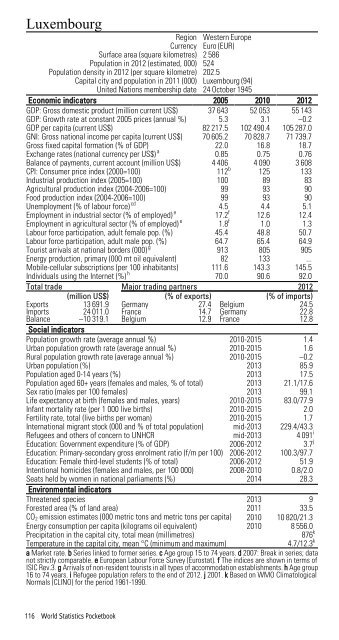
LuxembourgRegion Western EuropeCurrency Euro (EUR)Surface area (square kilometres) 2 586Population in 2012 (estimated, 000) 524Population density in 2012 (per square kilometre) 202.5Capital city and population in 2011 (000) Luxembourg (94)United Nations membership date 24 October 1945Economic indicators 2005 2010 2012GDP: Gross domestic product (million current US$) 37 643 52 053 55 143GDP: Growth rate at constant 2005 prices (annual %) 5.3 3.1 –0.2GDP per capita (current US$) 82 217.5 102 490.4 105 287.0GNI: Gross national income per capita (current US$) 70 605.2 70 828.7 71 739.7Gross fixed capital formation (% of GDP) 22.0 16.8 18.7Exchange rates (national currency per US$) a 0.85 0.75 0.76Balance of payments, current account (million US$) 4 406 4 090 3 608CPI: Consumer price index (2000=100) 112 b 125 133Industrial production index (2005=100) 100 89 83Agricultural production index (2004-2006=100) 99 93 90Food production index (2004-2006=100) 99 93 90Unemployment (% of labour force) cd 4.5 4.4 5.1Employment in industrial sector (% of employed) e 17.2 f 12.6 12.4Employment in agricultural sector (% of employed) e 1.8 f 1.0 1.3Labour force participation, adult female pop. (%) 45.4 48.8 50.7Labour force participation, adult male pop. (%) 64.7 65.4 64.9Tourist arrivals at national borders (000) g 913 805 905Energy production, primary (000 mt oil equivalent) 82 133 ...Mobile-cellular subscriptions (per 100 inhabitants) 111.6 143.3 145.5Individuals using the Internet (%) h 70.0 90.6 92.0Total trade Major trading partners 2012(million US$) (% of exports) (% of imports)Exports 13 691.9 Germany 27.4 Belgium 24.5Imports 24 011.0 France 14.7 Germany 22.8Balance –10 319.1 Belgium 12.9 France 12.8Social indicatorsPopulation growth rate (average annual %) 2010-2015 1.4Urban population growth rate (average annual %) 2010-2015 1.6Rural population growth rate (average annual %) 2010-2015 –0.2Urban population (%) 2013 85.9Population aged 0-14 years (%) 2013 17.5Population aged 60+ years (females and males, % of total) 2013 21.1/17.6Sex ratio (males per 100 females) 2013 99.1Life expectancy at birth (females and males, years) 2010-2015 83.0/77.9Infant mortality rate (per 1 000 live births) 2010-2015 2.0Fertility rate, total (live births per woman) 2010-2015 1.7International migrant stock (000 and % of total population) mid-2013 229.4/43.3Refugees and others of concern to UNHCR mid-2013 4 091 iEducation: Government expenditure (% of GDP) 2006-2012 3.7 jEducation: Primary-secondary gross enrolment ratio (f/m per 100) 2006-2012 100.3/97.7Education: Female third-level students (% of total) 2006-2012 51.9Intentional homicides (females and males, per 100 000) 2008-2010 0.8/2.0Seats held by women in national parliaments (%) 2014 28.3Environmental indicatorsThreatened species 2013 9Forested area (% of land area) 2011 33.5CO 2 emission estimates (000 metric tons and metric tons per capita) 2010 10 820/21.3Energy consumption per capita (kilograms oil equivalent) 2010 8 556.0Precipitation in the capital city, total mean (millimetres)876 kTemperature in the capital city, mean °C (minimum and maximum)4.7/12.3 ka Market rate. b Series linked to former series. c Age group 15 to 74 years. d 2007: Break in series; datanot strictly comparable. e European Labour Force Survey (Eurostat). f The indices are shown in terms ofISIC Rev.3. g Arrivals of non-resident tourists in all types of accommodation establishments. h Age group16 to 74 years. i Refugee population refers to the end of 2012. j 2001. k Based on WMO ClimatologicalNormals (CLINO) for the period 1961-1990.116 World Statistics Pocketbook