

STATISTICS
c2drS
c2drS
- No tags were found...

Create successful ePaper yourself
Turn your PDF publications into a flip-book with our unique Google optimized e-Paper software.
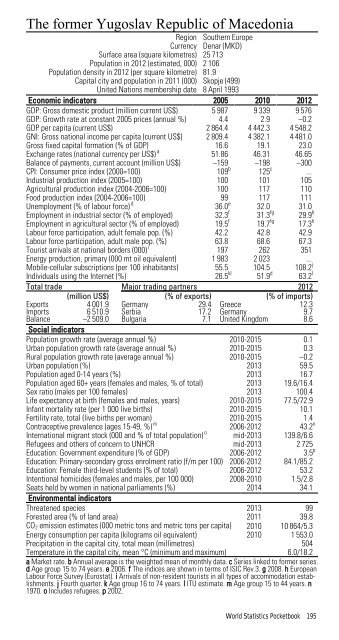
The former Yugoslav Republic of MacedoniaRegion Southern EuropeCurrency Denar (MKD)Surface area (square kilometres) 25 713Population in 2012 (estimated, 000) 2 106Population density in 2012 (per square kilometre) 81.9Capital city and population in 2011 (000) Skopje (499)United Nations membership date 8 April 1993Economic indicators 2005 2010 2012GDP: Gross domestic product (million current US$) 5 987 9 339 9 576GDP: Growth rate at constant 2005 prices (annual %) 4.4 2.9 –0.2GDP per capita (current US$) 2 864.4 4 442.3 4 548.2GNI: Gross national income per capita (current US$) 2 809.4 4 382.1 4 481.0Gross fixed capital formation (% of GDP) 16.6 19.1 23.0Exchange rates (national currency per US$) a 51.86 46.31 46.65Balance of payments, current account (million US$) –159 –198 –300CPI: Consumer price index (2000=100) 109 b 125 c ...Industrial production index (2005=100) 100 101 105Agricultural production index (2004-2006=100) 100 117 110Food production index (2004-2006=100) 99 117 111Unemployment (% of labour force) d 36.0 e 32.0 31.0Employment in industrial sector (% of employed) 32.3 f 31.3 fg 29.9 hEmployment in agricultural sector (% of employed) 19.5 f 19.7 fg 17.3 hLabour force participation, adult female pop. (%) 42.2 42.8 42.9Labour force participation, adult male pop. (%) 63.8 68.6 67.3Tourist arrivals at national borders (000) i 197 262 351Energy production, primary (000 mt oil equivalent) 1 983 2 023 ...Mobile-cellular subscriptions (per 100 inhabitants) 55.5 104.5 108.2 jIndividuals using the Internet (%) 26.5 kl 51.9 d 63.2 lTotal trade Major trading partners 2012(million US$) (% of exports) (% of imports)Exports 4 001.9 Germany 29.4 Greece 12.3Imports 6 510.9 Serbia 17.2 Germany 9.7Balance –2 509.0 Bulgaria 7.1 United Kingdom 8.6Social indicatorsPopulation growth rate (average annual %) 2010-2015 0.1Urban population growth rate (average annual %) 2010-2015 0.3Rural population growth rate (average annual %) 2010-2015 –0.2Urban population (%) 2013 59.5Population aged 0-14 years (%) 2013 16.7Population aged 60+ years (females and males, % of total) 2013 19.6/16.4Sex ratio (males per 100 females) 2013 100.4Life expectancy at birth (females and males, years) 2010-2015 77.5/72.9Infant mortality rate (per 1 000 live births) 2010-2015 10.1Fertility rate, total (live births per woman) 2010-2015 1.4Contraceptive prevalence (ages 15-49, %) m 2006-2012 43.2 nInternational migrant stock (000 and % of total population) o mid-2013 139.8/6.6Refugees and others of concern to UNHCR mid-2013 2 725Education: Government expenditure (% of GDP) 2006-2012 3.5 pEducation: Primary-secondary gross enrolment ratio (f/m per 100) 2006-2012 84.1/85.2Education: Female third-level students (% of total) 2006-2012 53.2Intentional homicides (females and males, per 100 000) 2008-2010 1.5/2.8Seats held by women in national parliaments (%) 2014 34.1Environmental indicatorsThreatened species 2013 99Forested area (% of land area) 2011 39.8CO 2 emission estimates (000 metric tons and metric tons per capita) 2010 10 864/5.3Energy consumption per capita (kilograms oil equivalent) 2010 1 553.0Precipitation in the capital city, total mean (millimetres) 504Temperature in the capital city, mean °C (minimum and maximum) 6.0/18.2a Market rate. b Annual average is the weighted mean of monthly data. c Series linked to former series.d Age group 15 to 74 years. e 2006. f The indices are shown in terms of ISIC Rev.3. g 2008. h EuropeanLabour Force Survey (Eurostat). i Arrivals of non-resident tourists in all types of accommodation establishments.j Fourth quarter. k Age group 16 to 74 years. l ITU estimate. m Age group 15 to 44 years. n1970. o Includes refugees. p 2002.World Statistics Pocketbook 195