

STATISTICS
c2drS
c2drS
- No tags were found...

Create successful ePaper yourself
Turn your PDF publications into a flip-book with our unique Google optimized e-Paper software.
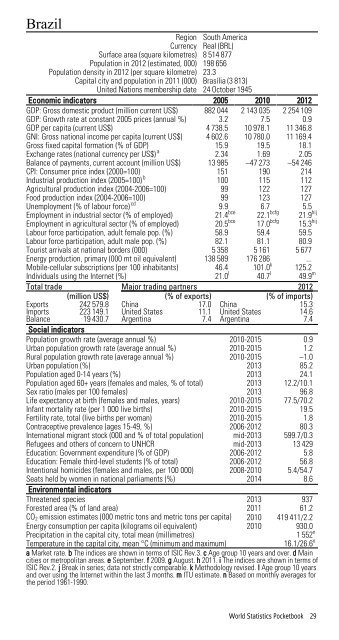
BrazilRegion South AmericaCurrency Real (BRL)Surface area (square kilometres) 8 514 877Population in 2012 (estimated, 000) 198 656Population density in 2012 (per square kilometre) 23.3Capital city and population in 2011 (000) Brasília (3 813)United Nations membership date 24 October 1945Economic indicators 2005 2010 2012GDP: Gross domestic product (million current US$) 882 044 2 143 035 2 254 109GDP: Growth rate at constant 2005 prices (annual %) 3.2 7.5 0.9GDP per capita (current US$) 4 738.5 10 978.1 11 346.8GNI: Gross national income per capita (current US$) 4 602.6 10 780.0 11 169.4Gross fixed capital formation (% of GDP) 15.9 19.5 18.1Exchange rates (national currency per US$) a 2.34 1.69 2.05Balance of payments, current account (million US$) 13 985 –47 273 –54 246CPI: Consumer price index (2000=100) 151 190 214Industrial production index (2005=100) b 100 115 112Agricultural production index (2004-2006=100) 99 122 127Food production index (2004-2006=100) 99 123 127Unemployment (% of labour force) cd 9.9 6.7 5.5Employment in industrial sector (% of employed) 21.4 bce 22.1 bcfg 21.9 hijEmployment in agricultural sector (% of employed) 20.5 bce 17.0 bcfg 15.3 hijLabour force participation, adult female pop. (%) 58.9 59.4 59.5Labour force participation, adult male pop. (%) 82.1 81.1 80.9Tourist arrivals at national borders (000) 5 358 5 161 5 677Energy production, primary (000 mt oil equivalent) 138 589 176 286 ...Mobile-cellular subscriptions (per 100 inhabitants) 46.4 101.0 k 125.2Individuals using the Internet (%) 21.0 l 40.7 l 49.9 mTotal trade Major trading partners 2012(million US$) (% of exports) (% of imports)Exports 242 579.8 China 17.0 China 15.3Imports 223 149.1 United States 11.1 United States 14.6Balance 19 430.7 Argentina 7.4 Argentina 7.4Social indicatorsPopulation growth rate (average annual %) 2010-2015 0.9Urban population growth rate (average annual %) 2010-2015 1.2Rural population growth rate (average annual %) 2010-2015 –1.0Urban population (%) 2013 85.2Population aged 0-14 years (%) 2013 24.1Population aged 60+ years (females and males, % of total) 2013 12.2/10.1Sex ratio (males per 100 females) 2013 96.8Life expectancy at birth (females and males, years) 2010-2015 77.5/70.2Infant mortality rate (per 1 000 live births) 2010-2015 19.5Fertility rate, total (live births per woman) 2010-2015 1.8Contraceptive prevalence (ages 15-49, %) 2006-2012 80.3International migrant stock (000 and % of total population) mid-2013 599.7/0.3Refugees and others of concern to UNHCR mid-2013 13 429Education: Government expenditure (% of GDP) 2006-2012 5.8Education: Female third-level students (% of total) 2006-2012 56.8Intentional homicides (females and males, per 100 000) 2008-2010 5.4/54.7Seats held by women in national parliaments (%) 2014 8.6Environmental indicatorsThreatened species 2013 937Forested area (% of land area) 2011 61.2CO 2 emission estimates (000 metric tons and metric tons per capita) 2010 419 411/2.2Energy consumption per capita (kilograms oil equivalent) 2010 930.0Precipitation in the capital city, total mean (millimetres)1 552 nTemperature in the capital city, mean °C (minimum and maximum)16.1/26.6 na Market rate. b The indices are shown in terms of ISIC Rev.3. c Age group 10 years and over. d Maincities or metropolitan areas. e September. f 2009. g August. h 2011. i The indices are shown in terms ofISIC Rev.2. j Break in series; data not strictly comparable. k Methodology revised. l Age group 10 yearsand over using the Internet within the last 3 months. m ITU estimate. n Based on monthly averages forthe period 1961-1990.World Statistics Pocketbook 29