

STATISTICS
c2drS
c2drS
- No tags were found...

You also want an ePaper? Increase the reach of your titles
YUMPU automatically turns print PDFs into web optimized ePapers that Google loves.
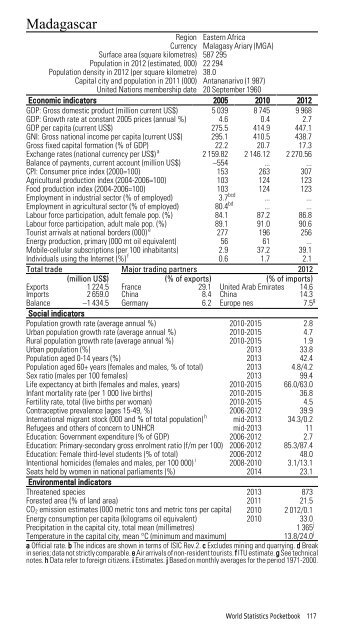
MadagascarRegion Eastern AfricaCurrency Malagasy Ariary (MGA)Surface area (square kilometres) 587 295Population in 2012 (estimated, 000) 22 294Population density in 2012 (per square kilometre) 38.0Capital city and population in 2011 (000) Antananarivo (1 987)United Nations membership date 20 September 1960Economic indicators 2005 2010 2012GDP: Gross domestic product (million current US$) 5 039 8 745 9 968GDP: Growth rate at constant 2005 prices (annual %) 4.6 0.4 2.7GDP per capita (current US$) 275.5 414.9 447.1GNI: Gross national income per capita (current US$) 295.1 410.5 438.7Gross fixed capital formation (% of GDP) 22.2 20.7 17.3Exchange rates (national currency per US$) a 2 159.82 2 146.12 2 270.56Balance of payments, current account (million US$) –554 ... ...CPI: Consumer price index (2000=100) 153 263 307Agricultural production index (2004-2006=100) 103 124 123Food production index (2004-2006=100) 103 124 123Employment in industrial sector (% of employed) 3.7 bcd ... ...Employment in agricultural sector (% of employed) 80.4 bd ... ...Labour force participation, adult female pop. (%) 84.1 87.2 86.8Labour force participation, adult male pop. (%) 89.1 91.0 90.6Tourist arrivals at national borders (000) e 277 196 256Energy production, primary (000 mt oil equivalent) 56 61 ...Mobile-cellular subscriptions (per 100 inhabitants) 2.9 37.2 39.1Individuals using the Internet (%) f 0.6 1.7 2.1Total trade Major trading partners 2012(million US$) (% of exports) (% of imports)ExportsImports1 224.52 659.0FranceChina29.18.4United Arab EmiratesChina14.614.3Balance –1 434.5 Germany 6.2 Europe nes 7.5 gSocial indicatorsPopulation growth rate (average annual %) 2010-2015 2.8Urban population growth rate (average annual %) 2010-2015 4.7Rural population growth rate (average annual %) 2010-2015 1.9Urban population (%) 2013 33.8Population aged 0-14 years (%) 2013 42.4Population aged 60+ years (females and males, % of total) 2013 4.8/4.2Sex ratio (males per 100 females) 2013 99.4Life expectancy at birth (females and males, years) 2010-2015 66.0/63.0Infant mortality rate (per 1 000 live births) 2010-2015 36.8Fertility rate, total (live births per woman) 2010-2015 4.5Contraceptive prevalence (ages 15-49, %) 2006-2012 39.9International migrant stock (000 and % of total population) h mid-2013 34.3/0.2Refugees and others of concern to UNHCR mid-2013 11Education: Government expenditure (% of GDP) 2006-2012 2.7Education: Primary-secondary gross enrolment ratio (f/m per 100) 2006-2012 85.3/87.4Education: Female third-level students (% of total) 2006-2012 48.0Intentional homicides (females and males, per 100 000) i 2008-2010 3.1/13.1Seats held by women in national parliaments (%) 2014 23.1Environmental indicatorsThreatened species 2013 873Forested area (% of land area) 2011 21.5CO 2 emission estimates (000 metric tons and metric tons per capita) 2010 2 012/0.1Energy consumption per capita (kilograms oil equivalent) 2010 33.0Precipitation in the capital city, total mean (millimetres)1 365 jTemperature in the capital city, mean °C (minimum and maximum)13.8/24.0 ja Official rate. b The indices are shown in terms of ISIC Rev.2. c Excludes mining and quarrying. d Breakin series; data not strictly comparable. e Air arrivals of non-resident tourists. f ITU estimate. g See technicalnotes. h Data refer to foreign citizens. i Estimates. j Based on monthly averages for the period 1971-2000.World Statistics Pocketbook 117