- Page 1 and 2:
Proceedings of the 7th European Con
- Page 3 and 4:
Contents Paper Title Author(s) Page
- Page 5 and 6:
Paper Title Author(s) Page No. Netw
- Page 7 and 8:
Paper Title Author(s) Page No. Impa
- Page 9 and 10:
Preface These proceedings represent
- Page 11 and 12:
UK); Erdei Gábor (University of De
- Page 13 and 14:
and innovation management and strat
- Page 15 and 16:
neering and Cost Analysis, at under
- Page 17 and 18:
Izold Guihur is a professor of mana
- Page 19 and 20:
Bala Mulloth is an assistant profes
- Page 21:
Jiro Usugami is a Professor of Mana
- Page 24 and 25:
Ioannis Akritidis and Alexandros Ka
- Page 26 and 27:
Ioannis Akritidis and Alexandros Ka
- Page 28 and 29:
Ioannis Akritidis and Alexandros Ka
- Page 30 and 31:
Service Design Systems Driven Innov
- Page 32 and 33:
Mohammed AlSudairi and TGK Vasista
- Page 34 and 35:
Mohammed AlSudairi and TGK Vasista
- Page 36 and 37:
Mohammed AlSudairi and TGK Vasista
- Page 38 and 39:
Mohammed AlSudairi and TGK Vasista
- Page 40 and 41:
Christos Apostolakis, José Carlos
- Page 42 and 43:
Christos Apostolakis, José Carlos
- Page 44 and 45:
Christos Apostolakis, José Carlos
- Page 46 and 47:
Christos Apostolakis, José Carlos
- Page 48 and 49:
Certifying Innovation: A Proposal f
- Page 50 and 51:
3. The certification of IMS Anna Ar
- Page 52 and 53:
Anna Arnò, Stefano De Falco and Gu
- Page 54 and 55:
Anna Arnò, Stefano De Falco and Gu
- Page 56 and 57:
The Main Drivers of Financial Innov
- Page 58 and 59:
Claudia Gabriela Baicu, Olimpia Sta
- Page 60 and 61:
Claudia Gabriela Baicu, Olimpia Sta
- Page 62 and 63:
Claudia Gabriela Baicu, Olimpia Sta
- Page 64 and 65:
Fernando Barbosa and Fernando Romer
- Page 66 and 67:
Fernando Barbosa and Fernando Romer
- Page 68 and 69:
Fernando Barbosa and Fernando Romer
- Page 70 and 71:
Fernando Barbosa and Fernando Romer
- Page 72 and 73:
Maria de Lurdes Calisto and Soumodi
- Page 74 and 75:
Maria de Lurdes Calisto and Soumodi
- Page 76 and 77:
Maria de Lurdes Calisto and Soumodi
- Page 78 and 79:
Maria de Lurdes Calisto and Soumodi
- Page 80 and 81:
2. Innovation Luísa Carvalho, Tere
- Page 82 and 83:
Luísa Carvalho, Teresa Costa and S
- Page 84 and 85:
Luísa Carvalho, Teresa Costa and S
- Page 86 and 87:
Luísa Carvalho, Teresa Costa and S
- Page 88 and 89:
Luísa Carvalho, Teresa Costa and S
- Page 90 and 91:
Enterprise Potential of Portuguese
- Page 92 and 93:
Maria Isabel Carvalho et al. Peterm
- Page 94 and 95:
Maria Isabel Carvalho et al. � H5
- Page 96 and 97:
Maria Isabel Carvalho et al. 325 re
- Page 98 and 99:
Maria Isabel Carvalho et al. Since
- Page 100 and 101:
Maria Isabel Carvalho et al. Lee, L
- Page 102 and 103:
Adina Catana and Lavinia Delcea the
- Page 104 and 105:
Adina Catana and Lavinia Delcea Wit
- Page 106 and 107:
Adina Catana and Lavinia Delcea Sou
- Page 108 and 109:
Adina Catana and Lavinia Delcea 2.3
- Page 110 and 111:
Adina Catana and Lavinia Delcea 201
- Page 112 and 113:
The use of Multi-Criteria Analysis
- Page 114 and 115:
Piotr Chwastyk innovation. Stage-Ga
- Page 116 and 117:
Piotr Chwastyk participation of a t
- Page 118 and 119:
Piotr Chwastyk properly conducted a
- Page 120 and 121:
Ana Cordeiro and Filipa Vieira Comp
- Page 122 and 123:
Ana Cordeiro and Filipa Vieira The
- Page 124 and 125:
Ana Cordeiro and Filipa Vieira With
- Page 126 and 127:
Ana Cordeiro and Filipa Vieira Comt
- Page 128 and 129:
Teresa Costa and Luísa Carvalho ac
- Page 130 and 131:
Teresa Costa and Luísa Carvalho or
- Page 132 and 133:
Project name Public target “Capit
- Page 134 and 135:
Teresa Costa and Luísa Carvalho Ta
- Page 136 and 137:
Appendix 1: Interview guide Referen
- Page 138 and 139:
Does it Make Sense to go Against "S
- Page 140 and 141:
Oscar Cristi, José Ernesto Amorós
- Page 142 and 143:
Oscar Cristi, José Ernesto Amorós
- Page 144 and 145:
Oscar Cristi, José Ernesto Amorós
- Page 146 and 147:
Oscar Cristi, José Ernesto Amorós
- Page 148 and 149:
Pat Daly and James Walsh organisati
- Page 150 and 151:
Pat Daly and James Walsh positive i
- Page 152 and 153:
Pat Daly and James Walsh Having int
- Page 154 and 155:
Pat Daly and James Walsh McGrath, R
- Page 156 and 157:
Luc De Grez and Dirk Van Lindt succ
- Page 158 and 159:
3.3 Method Luc De Grez and Dirk Van
- Page 160 and 161:
Luc De Grez and Dirk Van Lindt Wilc
- Page 162 and 163:
Nanotechnologies and Eco-Innovation
- Page 164 and 165:
Aurelie Delemarle and Claire Auplat
- Page 166 and 167:
Aurelie Delemarle and Claire Auplat
- Page 168 and 169:
Aurelie Delemarle and Claire Auplat
- Page 170 and 171:
Aurelie Delemarle and Claire Auplat
- Page 172 and 173:
Carine Deslee are concerned. We wil
- Page 174 and 175:
Carine Deslee Innovation. Its aim i
- Page 176 and 177:
Carine Deslee of how Participative
- Page 178 and 179:
Carine Deslee To conclude, we show
- Page 180 and 181:
Motivations and Attitudes Towards F
- Page 182 and 183:
Anca Otilia Dodescu et al. business
- Page 184 and 185:
Anca Otilia Dodescu et al. intuitio
- Page 186 and 187:
Anca Otilia Dodescu et al. funding
- Page 188 and 189:
Fostering SMEs and Innovation: Chal
- Page 190 and 191:
Anca Dodescu establishing an effici
- Page 192 and 193:
Anca Dodescu performance external t
- Page 194 and 195:
Acknowledgments Anca Dodescu The pa
- Page 196 and 197:
Entrepreneurial Capital: The Experi
- Page 198 and 199:
Thomas Domboka performance of their
- Page 200 and 201:
Thomas Domboka What seemed apparent
- Page 202 and 203:
Belonging to business Associations
- Page 204 and 205:
Thomas Domboka comparative study wi
- Page 206 and 207:
Carolyn Downs Lambros Lazuras and P
- Page 208 and 209:
Carolyn Downs Lambros Lazuras and P
- Page 210 and 211:
Carolyn Downs Lambros Lazuras and P
- Page 212 and 213:
Fostering Creativity and Innovation
- Page 214 and 215:
Claudia Erni Baumann, Frank Zoller
- Page 216 and 217:
Claudia Erni Baumann, Frank Zoller
- Page 218 and 219:
Claudia Erni Baumann, Frank Zoller
- Page 220 and 221:
Entrepreneurial Attitudes and Perce
- Page 222 and 223:
3. Methodology 3.1 Data Paula Odete
- Page 224 and 225:
Country Paula Odete Fernandes, Joã
- Page 226 and 227:
Paula Odete Fernandes, João Ferrei
- Page 228 and 229:
Paula Odete Fernandes, João Ferrei
- Page 230 and 231:
Potentialities of Public eProcureme
- Page 232 and 233:
Isabel Ferreira and Luís Alfredo A
- Page 234 and 235:
Isabel Ferreira and Luís Alfredo A
- Page 236 and 237:
Isabel Ferreira and Luís Alfredo A
- Page 238 and 239:
Isabel Ferreira and Luís Alfredo A
- Page 240 and 241:
Ana Ferreira et al. micro gas turbi
- Page 242 and 243:
Ana Ferreira et al. Figure 1: Portu
- Page 244 and 245:
3.2 Benefits of micro-CHP Ana Ferre
- Page 246 and 247:
Ana Ferreira et al. Figure 3: Growt
- Page 248 and 249:
The Influence of Innovative Capacit
- Page 250 and 251:
3. Methodology Sample and Data Joã
- Page 252 and 253:
João Ferreira, Mário Raposo and C
- Page 254 and 255:
João Ferreira, Mário Raposo and C
- Page 256 and 257:
João Ferreira, Mário Raposo and C
- Page 258 and 259:
Stelian-Cornel Florica and George D
- Page 260 and 261:
Stelian-Cornel Florica and George D
- Page 262 and 263:
Stelian-Cornel Florica and George D
- Page 264 and 265:
Stelian-Cornel Florica and George D
- Page 266 and 267:
Stelian-Cornel Florica and George D
- Page 268 and 269:
Brendan Galbraith et al. Competiven
- Page 270 and 271:
Brendan Galbraith et al. The proces
- Page 272 and 273:
References Brendan Galbraith et al.
- Page 274 and 275:
Where are They now? A Entrepreneurs
- Page 276 and 277:
Laura Galloway, Isla Kapasi and Geo
- Page 278 and 279:
Laura Galloway, Isla Kapasi and Geo
- Page 280 and 281:
6. Discussion Laura Galloway, Isla
- Page 282 and 283: Laura Galloway, Isla Kapasi and Geo
- Page 284 and 285: Oleg Golichenko and Svetlana Samovo
- Page 286 and 287: Oleg Golichenko and Svetlana Samovo
- Page 288 and 289: Oleg Golichenko and Svetlana Samovo
- Page 290 and 291: Oleg Golichenko and Svetlana Samovo
- Page 292 and 293: Oleg Golichenko and Svetlana Samovo
- Page 294 and 295: Elissaveta Gourova, Ivan Draganov a
- Page 296 and 297: Elissaveta Gourova, Ivan Draganov a
- Page 298 and 299: Elissaveta Gourova, Ivan Draganov a
- Page 300 and 301: Elissaveta Gourova, Ivan Draganov a
- Page 302 and 303: Elissaveta Gourova, Ivan Draganov a
- Page 304 and 305: Izold Guihur and Gilles Marcoux org
- Page 306 and 307: Izold Guihur and Gilles Marcoux of
- Page 308 and 309: Izold Guihur and Gilles Marcoux was
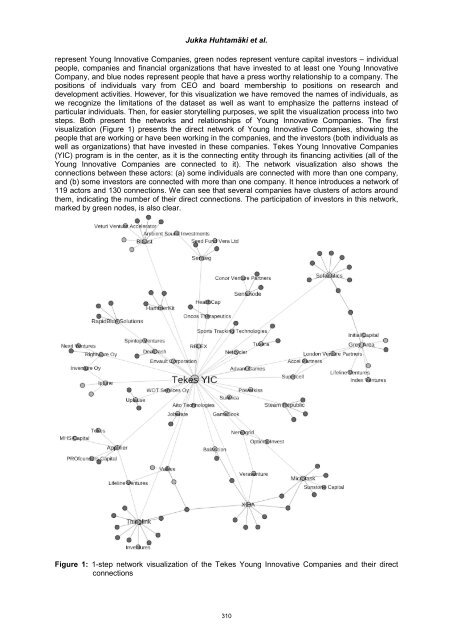
- Page 310 and 311: Izold Guihur and Gilles Marcoux Par
- Page 312 and 313: Heiko Haase, Mário Franco and Ant
- Page 314 and 315: Heiko Haase, Mário Franco and Ant
- Page 316 and 317: Heiko Haase, Mário Franco and Ant
- Page 318 and 319: Heiko Haase, Mário Franco and Ant
- Page 320 and 321: Takashi Hirao and Yusuke Hoshino We
- Page 322 and 323: Takashi Hirao and Yusuke Hoshino As
- Page 324 and 325: Takashi Hirao and Yusuke Hoshino 4.
- Page 326 and 327: Takashi Hirao and Yusuke Hoshino ma
- Page 328 and 329: Takashi Hirao and Yusuke Hoshino Fu
- Page 330 and 331: Jukka Huhtamäki et al. innovation
- Page 334 and 335: Jukka Huhtamäki et al. Figure 3: T
- Page 336 and 337: Jukka Huhtamäki et al. about gatek
- Page 338 and 339: Spin-Off Performance: Entrepreneuri
- Page 340 and 341: Thanh Huynh, Daniel Aranda and Luis
- Page 342 and 343: -order CFA Measurement model Thanh
- Page 344 and 345: Thanh Huynh, Daniel Aranda and Luis
- Page 346 and 347: An Agile Approach for Measuring the
- Page 348 and 349: Monica Izvercianu and Cella-Flavia
- Page 350 and 351: Monica Izvercianu and Cella-Flavia
- Page 352 and 353: Monica Izvercianu and Cella-Flavia
- Page 354 and 355: Prosumer Involvement in Innovation
- Page 356 and 357: Monica Izvercianu and Sabina Şeran
- Page 358 and 359: Monica Izvercianu and Sabina Şeran
- Page 360 and 361: Monica Izvercianu and Sabina Şeran
- Page 362 and 363: The Competitive Advantage for Early
- Page 364 and 365: Maroun Jneid and Antoine Tannous ma
- Page 366 and 367: Maroun Jneid and Antoine Tannous Fi
- Page 368 and 369: Maroun Jneid and Antoine Tannous We
- Page 370 and 371: 7.2 Managerial contributions Maroun
- Page 372 and 373: 1.1 Innovation management Magdalena
- Page 374 and 375: esearch based on literature Areas o
- Page 376 and 377: Magdalena Jurczyk - Bunkowska descr
- Page 378 and 379: Magdalena Jurczyk - Bunkowska stage
- Page 380 and 381: Ontologies Enable Innovation Jussi
- Page 382 and 383:
Jussi Kantola and Hannu Vanharanta
- Page 384 and 385:
5. Ontology-based asymmetry Jussi K
- Page 386 and 387:
Table 2: Knowledge innovation scope
- Page 388 and 389:
Fusing Technology, Innovation and E
- Page 390 and 391:
Panayiotis Ketikidis et al. industr
- Page 392 and 393:
Panayiotis Ketikidis et al. 3.4 Pro
- Page 394 and 395:
Panayiotis Ketikidis et al. dissemi
- Page 396 and 397:
Panayiotis Ketikidis et al. variety
- Page 398 and 399:
Developing Øresund Region’s Inno
- Page 400 and 401:
3. Methodology Peter Kiryushin, Bal
- Page 402 and 403:
Peter Kiryushin, Bala Mulloth and T
- Page 404 and 405:
Peter Kiryushin, Bala Mulloth and T
- Page 406 and 407:
At the Intersection of Dynamic Capa
- Page 408 and 409:
3. Hypothesis development İpek Ko
- Page 410 and 411:
Organizational Learning Capability
- Page 412 and 413:
İpek Koçoğlu; Salih Zeki İmamo
- Page 414 and 415:
İpek Koçoğlu; Salih Zeki İmamo
- Page 416 and 417:
The Significance of the LGBT-Commun
- Page 418 and 419:
Thomas Köllen, Regine Bendl and Sa
- Page 420 and 421:
Thomas Köllen, Regine Bendl and Sa
- Page 422 and 423:
Thomas Köllen, Regine Bendl and Sa
- Page 424 and 425:
Thomas Köllen, Regine Bendl and Sa
- Page 426 and 427:
Crowdinvesting, an Innovative Optio
- Page 428 and 429:
Hanno Kortleben and Bernhard Vollma
- Page 430 and 431:
Hanno Kortleben and Bernhard Vollma
- Page 432 and 433:
Appendix 1 Hanno Kortleben and Bern
- Page 434 and 435:
References Hanno Kortleben and Bern
- Page 436 and 437:
2. Quality management in services Y
- Page 438 and 439:
Yvonne Lagrosen and Stefan Lagrosen
- Page 440 and 441:
Yvonne Lagrosen and Stefan Lagrosen
- Page 442 and 443:
Innovation and Entrepreneurship Stu
- Page 444 and 445:
Hans Landström, Gouya Harirchi and
- Page 446 and 447:
Hans Landström, Gouya Harirchi and
- Page 448 and 449:
Hans Landström, Gouya Harirchi and
- Page 450 and 451:
Hans Landström, Gouya Harirchi and
- Page 452 and 453:
Exploring Regulatory Focus, Entrepr
- Page 454 and 455:
Zaidatol Akmaliah Lope Pihie, Afsan
- Page 456 and 457:
Zaidatol Akmaliah Lope Pihie, Afsan
- Page 458 and 459:
Zaidatol Akmaliah Lope Pihie, Afsan
- Page 460 and 461:
The Size of an Enterprise and Enhan
- Page 462 and 463:
Ladislav Ludvík and Jindra Peterko
- Page 464 and 465:
Ladislav Ludvík and Jindra Peterko
- Page 466 and 467:
Ladislav Ludvík and Jindra Peterko
- Page 468 and 469:
Ladislav Ludvík and Jindra Peterko
- Page 470 and 471:
MariaJesus Luengo and Maria Obeso I
- Page 472 and 473:
MariaJesus Luengo and Maria Obeso O
- Page 474 and 475:
MariaJesus Luengo and Maria Obeso A
- Page 476 and 477:
MariaJesus Luengo and Maria Obeso s