- Page 2 and 3:
(NOT) A REDD LIGHT DISTRICT?REDD po
- Page 4:
DECLARATIONWe, Cecilie Dyngeland an
- Page 8:
AbstractThis study focuses on the g
- Page 12 and 13:
Table of ContentsCHAPTER ONE - INTR
- Page 14:
7.5.4 OFF-FARM INCOME 2027.5.5 REMI
- Page 17 and 18:
List of TablesTable 1: Land use dis
- Page 19 and 20:
List of Abbreviations and AcronymsC
- Page 21 and 22:
CHAPTER ONE - INTRODUCTION1.1 Intro
- Page 23 and 24:
As a result of the ongoing REDD rea
- Page 25 and 26:
Brachystegia, Julbernardia and Isob
- Page 27 and 28:
livestock populations increase in T
- Page 29 and 30:
een trying to deal with the issue,
- Page 31 and 32:
under the CDM were afforestation an
- Page 33 and 34:
REDD+ “readiness” funding provi
- Page 35 and 36:
with the other FCPF countries (Unit
- Page 37 and 38:
Due to both limitations of time and
- Page 39 and 40:
4 How do they interact with local g
- Page 41 and 42:
the actors; (6) Outcomes and evalua
- Page 43 and 44:
influence the characteristics of th
- Page 45 and 46:
There are many examples of rules th
- Page 47 and 48:
for collective decision-making; bal
- Page 49 and 50:
2.1.5. Interactions between actors/
- Page 51 and 52:
2.2. Description of the Sustainable
- Page 53 and 54:
different income sources at a point
- Page 55 and 56:
Although income and livelihood are
- Page 57 and 58:
(4) Size of household: The size of
- Page 59 and 60:
a set of definitions to explain the
- Page 61 and 62:
country needs a robust forest monit
- Page 63 and 64:
may be equally important in determi
- Page 65 and 66:
transparency and the extra difficul
- Page 67 and 68:
access to motorized forest tools, s
- Page 69 and 70:
have the de jure right to restrict
- Page 71 and 72:
dwellers in the REDD process, in ma
- Page 73 and 74:
She argues that participation has b
- Page 75 and 76:
2.3.7.2 Model of individualsIn disc
- Page 77 and 78:
location, such as a community or or
- Page 79 and 80:
External validity, on the other han
- Page 81 and 82:
3.3.3 Semi-structured and structure
- Page 83 and 84:
Through survey research we needed t
- Page 85 and 86:
variables (Ys) and the explanatory
- Page 87 and 88:
All these components we felt clearl
- Page 89 and 90:
(Bryman 2008, p.118.), we followed
- Page 91 and 92:
Figure 5: Map over Kilosa DistrictL
- Page 93 and 94:
densely populated one with its 2622
- Page 95 and 96:
Figure 6: Agricultural production z
- Page 97 and 98:
establishment of more sisal estates
- Page 99 and 100:
are located, the total loss of fore
- Page 101 and 102:
communities such as the Maasai, Bar
- Page 103 and 104:
To sum up, Kilosa District can be c
- Page 105 and 106:
5.1 Priority of environmental manag
- Page 107 and 108:
established with the enactment of E
- Page 109 and 110:
esources and the environment, and t
- Page 111 and 112:
national forest reserves, i.e. both
- Page 113 and 114:
degradation (REDD)” is found, as
- Page 115 and 116:
The Forest Act thus sets the framew
- Page 117 and 118:
5.4 Tanzania local structure for en
- Page 119 and 120:
the 1970s and 1980s. Firstly, as pa
- Page 121 and 122:
5.4.3 District, Ward and Village Go
- Page 123 and 124:
Office and Regional Administration
- Page 125 and 126:
make sure the general population fo
- Page 127 and 128:
forest management activities by pla
- Page 129 and 130:
to the office within this period, w
- Page 131 and 132:
CHAPTER SIX - REDD IN TANZANIAIn th
- Page 133 and 134:
Analytical phaseEstablishing goals,
- Page 135 and 136:
Drivers 32 . Each working group is
- Page 137 and 138:
Table 8: Stakeholders involved in t
- Page 139 and 140:
esponsibilities with NEMC, which al
- Page 141 and 142:
cooperation with various academic i
- Page 143 and 144:
FORCONSULT‟s (2010) in-depth stud
- Page 145 and 146:
institutions (with the election of
- Page 147 and 148:
$500 million and lost governmental
- Page 149 and 150:
National FrameworkConsultationsNati
- Page 151 and 152:
Table 10: Zonal consultation proces
- Page 153 and 154:
together including government depar
- Page 155 and 156:
Modalities ofEstablishing andOperat
- Page 157 and 158:
Table 12: NGO REDD pilot projectsNG
- Page 159 and 160:
money, NGO‟s will adopt to the do
- Page 161 and 162:
REDD+ and provides them with perfor
- Page 163 and 164:
In the second phase, the consultati
- Page 165 and 166:
Figure 14: Proposed public structur
- Page 167 and 168: countries can participate according
- Page 169 and 170: the state administration, and budge
- Page 171 and 172: Table 6.6 REDD in relation to exist
- Page 173 and 174: 6.3 Major challenges for an effecti
- Page 175 and 176: view to be a precondition for a gra
- Page 177 and 178: 6.3.1.3 Coordination of activities
- Page 179 and 180: coordination system among key stake
- Page 181 and 182: 6.3.2 Institutions governing the po
- Page 183 and 184: that WMAs are completely overlooked
- Page 185 and 186: 6.3.2.2 Good Governance and Institu
- Page 187 and 188: should have to adhere to the same s
- Page 189 and 190: though, as some feel there has been
- Page 191 and 192: CHAPTER SEVEN - LOCAL LIVELIHOODS A
- Page 193 and 194: meaning that where households lived
- Page 195 and 196: 1 %28 %No formaleductaionPrimary71
- Page 197 and 198: From Table 15 we can see that it is
- Page 199 and 200: 7.1.3 Physical capitalIn general, a
- Page 201 and 202: The majority of people carried thei
- Page 203 and 204: By looking at the three different v
- Page 205 and 206: When compared to location, we see t
- Page 207 and 208: The types of crops produced seemed
- Page 209 and 210: primarily for consumption and only
- Page 211 and 212: Lastly, it appeared that the lack o
- Page 213 and 214: 7.2.4 Off-farm activitiesIn the stu
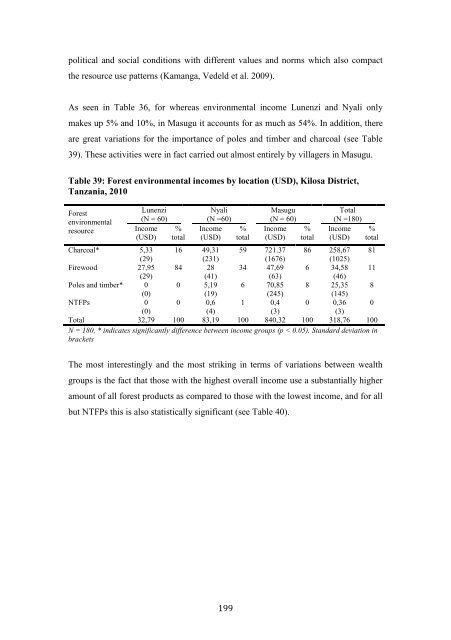
- Page 215 and 216: Table 35: Annual income sources by
- Page 217: and Masugu were quite close to one
- Page 221 and 222: Total household incomewere engaged
- Page 223 and 224: not being able to tend to own incom
- Page 225 and 226: livelihood strategies into two over
- Page 227 and 228: In terms of income groups, less poo
- Page 229 and 230: shocks and deforestation. Neverthel
- Page 231 and 232: turning to other income sources as
- Page 233 and 234: legal system within the district st
- Page 235 and 236: egulations in place to deal with th
- Page 237 and 238: In this chapter we have gone throug
- Page 239 and 240: outline the project as a whole with
- Page 241 and 242: Through the Rubeho Environmental Ac
- Page 243 and 244: organizations and research agencies
- Page 245 and 246: Key design issues for the issues fo
- Page 247 and 248: al. 2011). A team of 5 permanent st
- Page 249 and 250: this forest protection, however, va
- Page 251 and 252: On this note, another main reason f
- Page 253 and 254: As a final factor to take into cons
- Page 255 and 256: less are also highly dependent on f
- Page 257 and 258: Table 54: The authority viewed as b
- Page 259 and 260: 8.2.2.3 Stage two: Assessment and m
- Page 261 and 262: have made for the forest 48 . Final
- Page 263 and 264: When asked about the first option
- Page 265 and 266: 8.3. Existing RegimesAs emphasised,
- Page 267 and 268: From the table above there are seve
- Page 269 and 270:
REDD+ will succeed in the other are
- Page 271 and 272:
project, both in terms of permanenc
- Page 273 and 274:
example given previously about anot
- Page 275 and 276:
The full participation of district
- Page 277 and 278:
mismanagement there would be. It wa
- Page 279 and 280:
suffering the most from such a proj
- Page 281 and 282:
However, some issues still prevail
- Page 283 and 284:
wonder how these experts would valu
- Page 285 and 286:
As the basis of which carbon paymen
- Page 287 and 288:
ecome explicit and can increase con
- Page 289 and 290:
It is also highly obvious that deal
- Page 291 and 292:
However, it is a concern as in some
- Page 293 and 294:
and sell forest products such as ch
- Page 295 and 296:
if Masugu seems to face most challe
- Page 297 and 298:
On the basis of the information we
- Page 299 and 300:
In terms of Efficiency there are al
- Page 301 and 302:
In addition we found that further n
- Page 303 and 304:
the case for the poorest people in
- Page 305 and 306:
9.2 RecommendationsWhen analyzing t
- Page 307 and 308:
ReferencesAbdallah, J. M. and G. G.
- Page 309 and 310:
Bryman, A. (2008). Social research
- Page 311 and 312:
Forconsult (2010). Modalities of es
- Page 313 and 314:
Kooiman, J. (1993). Modern governan
- Page 315 and 316:
Nathan, I., J. F. Lund, et al. (200
- Page 317 and 318:
Shishira, E. K., P. Z. Yanda, et al
- Page 319 and 320:
United Republic of Tanzania (2009).
- Page 321 and 322:
World Bank (2009). Tanzania: countr
- Page 324:
iii
- Page 328 and 329:
LANDA10. Please indicate the size o
- Page 330 and 331:
A21. Does any member of your househ
- Page 332 and 333:
HC1. Do you practice fire on your l
- Page 334 and 335:
B12. How would you rate your access
- Page 336 and 337:
(NB: READ THE MANUAL ON INCOME CARE
- Page 338 and 339:
II.STATE FORESTS (FORESTS UNDER STA
- Page 340 and 341:
IIb. STATE FORESTS (JOINT FOREST MA
- Page 342 and 343:
C24. Do you have any influence on t
- Page 344 and 345:
C34. Do you face any difficulties i
- Page 346 and 347:
1Very bad 2 Bad 3 Fair 4 Good 5 Ver
- Page 348 and 349:
SECTION D: Perceptions, attitudes a
- Page 350 and 351:
___________________________________
- Page 352 and 353:
1 The compensation will make me equ