- Page 1 and 2:
E---~for-~-~and the Copper River B-
- Page 3:
SYLLABUSThe geographic area conside
- Page 6 and 7:
SOUTHCENTRAL RAILBELT AREA. ALASKAI
- Page 8 and 9:
INTRODUCTIONDue to continued growth
- Page 10 and 11:
The city of Valdez conducted enviro
- Page 12 and 13:
FIGURE I:HYDROPOWER STUDY AREAFOR V
- Page 14 and 15:
oard feet of hardwoods, half of whi
- Page 16 and 17:
VALDEZ
- Page 18 and 19:
ALYESKA PIPELINE TERMINAL
- Page 20 and 21:
Other Activities:Nonseasonal stable
- Page 22 and 23:
Table 3Historical Population of Val
- Page 24 and 25:
Transportation and Tourism:Detailed
- Page 26 and 27:
The following tables show the futur
- Page 28 and 29:
framework of the study authority an
- Page 30 and 31:
Nucl ear:Nuclear energy development
- Page 32 and 33:
lntertie:With the deciSlon by the C
- Page 34 and 35:
If the powerhouse were moved to jus
- Page 36 and 37:
CONSERVATION:Description:THE NONSTR
- Page 38 and 39:
TRANSMISSION INTERTIEDescription_:T
- Page 40 and 41:
impaired. As a result, standoy gene
- Page 42 and 43:
ALLISON LAKE
- Page 44 and 45:
From the time of pO\'Ier-on-line, o
- Page 46 and 47:
Technical services such as electron
- Page 48 and 49:
175150FIGURE: 2ENERGY DEMAND - REVI
- Page 50 and 51:
175150FIGURE: 4ENERGY - REVISED APA
- Page 52 and 53:
SYSTEMOF ACCOUNTSAccountsPlan AAll
- Page 54 and 55:
AccountsPlan A.All Diesel Generatio
- Page 56 and 57:
then be determined for the 100-year
- Page 58 and 59:
Comnents received from the city of
- Page 60 and 61:
FINALENVIRONMENTAL IMPACT STATEMENT
- Page 62 and 63:
LIST OF PRFPARERSNameExpert i seExp
- Page 64 and 65:
COMPARATIVE IMPACTS OF ALTERNATIVES
- Page 66 and 67:
AREAS OF CONTROVERSYTo date no spec
- Page 68 and 69:
COVER SHEETLIST OF PREPARERSFINAL E
- Page 70 and 71:
A. NEED FOR AND OBJECTIVES OF ACTIO
- Page 72 and 73:
alternative has been estimated to p
- Page 74 and 75:
slopes surrounding Allisorl Lake ar
- Page 76 and 77:
weir to the mouth, with the majorit
- Page 78 and 79:
expected to Allison Creek below All
- Page 80 and 81:
2. Biologicala. Vegetation:,r-.Hydr
- Page 82 and 83:
Waterfowl and water related birds f
- Page 84 and 85:
within the local community. The imp
- Page 86 and 87:
Cumulative impacts to the Port Vald
- Page 88 and 89:
Program-related issues. The Alaska
- Page 90 and 91:
13.10INDEXSubjectsAffected Environm
- Page 92 and 93:
APPENDIX AHYDROLOGYTABLE OF CONTENT
- Page 94 and 95:
snowfields and glacier areas on the
- Page 96 and 97:
AVERAGE MONTHLY PRECIPITATION(inche
- Page 98 and 99:
gages at Lowe River near Valdez, Lo
- Page 100 and 101:
were estimated based on Tonsina Riv
- Page 102 and 103:
'fUR r)c r ,-. n:c JA~ FEEl "'A~ AP
- Page 104 and 105:
--..,I-J--. -,-- - ----- - --TONS I
- Page 106 and 107:
ALLISON CREEKESTIMATED STREAMFLOW -
- Page 108 and 109:
APPENDIX BEXISTING SYSTEM ANDFUTURE
- Page 110 and 111:
IIHf{ODUCTIONThis section is devote
- Page 112 and 113:
FIGURE: B-1PRICE INCREASES OF DIESE
- Page 114 and 115:
Installed Generat.or Peak Energy fo
- Page 116 and 117:
90008000700060005000- 4000 ~..-:300
- Page 118 and 119:
Table 4VALDEZ-GLENNALLEN AREA UTILI
- Page 120 and 121:
As footnoted, the Alaska Power Admi
- Page 122 and 123:
201510CDI5.: ...:.T. .' !', ~. '.,
- Page 124 and 125:
SOLOMON HY I.IICU'-__'lOUIE 1-7 MlN
- Page 126 and 127:
, .. ,·.AYI.AG! fOWl. DlMANO WHit,
- Page 128 and 129:
The following is an excerpt from th
- Page 130 and 131:
Power Requirement Study (excerpt)GL
- Page 132 and 133:
APPENDIX CECONOMIC EVALUATION
- Page 134 and 135:
INTRODUCTIONThe purpose of this sec
- Page 136 and 137:
value of 66.92 mills/kWh. This figu
- Page 138 and 139:
FIGURE C-2: SOLOMON GULCH ALLISON L
- Page 140 and 141:
Er.Jployment Benefits Computation (
- Page 142 and 143:
energy would be fully utilized. As
- Page 144 and 145:
ECONOMIC EVALUATION OF HYDROPONER M
- Page 146 and 147:
ECONOMIC EV~LUATION OF HYDROPO~ER M
- Page 148 and 149:
------~-~ECONO~IC EVALUATION OF HYD
- Page 150 and 151:
ECONOMIC EVALUATION OF HYDROPO~ER M
- Page 152 and 153:
ECONO~IC EVALUATION OF HYDROPOwER M
- Page 154 and 155:
APPENDI X DPROJECT DESCRIPTION AND
- Page 156 and 157:
POWERHOUSETypeTRANSMISSION LINEVolt
- Page 158 and 159:
POWERHOUSETypeTRANSMISSION LINEVolt
- Page 160 and 161:
VALDEZ HYDROELECTRIC POWER PROJECTG
- Page 162 and 163:
turbine. The penstock would bifurca
- Page 164 and 165:
TABLE D-lSUMMARY COST ESTIMATEOCTOB
- Page 166 and 167:
TABLE 0-3DETAILED COST ESTIMATEVALD
- Page 168 and 169:
TABLE D- 3 (cont)Cost Unit Tota 1Ac
- Page 170 and 171:
TABL E D-4DETAILED COST ESTIMATEVAL
- Page 172 and 173:
TABLE D-4 (cont)Co st Unit Tota 1Ac
- Page 174 and 175:
, ..... ,..\ (I),;> "----f .'-.. -I
- Page 176 and 177:
"'~~TAPANDROCK TRAP1600.•. -~ "00
- Page 178 and 179:
CORPS OF ENGINEERSU. S. ARMY./f----
- Page 180 and 181:
APPENDIX EENVIRONMENTAL DATA
- Page 182 and 183:
TABLE 1ATEMPERATURE RECORDING OF AL
- Page 184 and 185:
TABLE 1A (cont)ALL! SON CREEK (cont
- Page 186 and 187:
TABLE 1A (cont)ALLISON CREEK (cont)
- Page 188 and 189:
ALLISON CREEK (cont)FEBRUARY HIGH L
- Page 190 and 191:
ALLISON CREEK (cant)TABLE lA (cant)
- Page 192 and 193:
TABLE 1A (cont)ALLISON CREEK (cont)
- Page 194 and 195:
TABLE 1A (cont)SOLOMON CREEK - HIGH
- Page 196 and 197:
TABLE 1A (cant)SOLOMON CREEK (cant)
- Page 198 and 199:
TABLE 1A (cont)SOLOMON CREEK (cont)
- Page 200 and 201:
TABLE lA (cont)SOLOMON CREEK (cont)
- Page 202 and 203:
TABLE 1A (cont)SOLOMON CREEK (cont)
- Page 204 and 205:
SOLOMON CREEK (cont)TABLE 1A (cont)
- Page 206 and 207:
TABLE 2ACalculated Flows of Allison
- Page 208 and 209:
TABLE 2BCalculated Flows of Allison
- Page 210 and 211:
TABLE 4AWater Quality Data of Allis
- Page 212 and 213:
TABLE 4A (cont)PARAMETERCalciumMagn
- Page 214 and 215:
TABLE 4A (cont)PARAMETERTurb i d it
- Page 216 and 217:
TABLE 4A (cont)PARAMETERTurb i d it
- Page 218 and 219:
TABLE 4BALLISON LAKEWA TER QUALI TV
- Page 220 and 221:
TABLE 6BIRDS OF THE PORT VALDEZ ARE
- Page 222 and 223:
Oregon JuncoTree SparrowWhite-crown
- Page 224 and 225:
UNITED STf-lrESDEPARTMENT OF THE IN
- Page 226 and 227:
c. Effects on Benthos: The proposed
- Page 228 and 229:
An ecological evalu~)tion as requir
- Page 230 and 231:
JAY S. HAMMO~D. GOVERNORDEPARTMENr
- Page 232 and 233:
CULTURAL RESOURCESAboriginal Settin
- Page 234 and 235:
shorp--probablv to facilitate easie
- Page 236 and 237:
Today the Alyeska oil terminal enco
- Page 238 and 239:
APPENDIX GFOUNDATIONS AND MATERIALS
- Page 240 and 241:
100 psi pressure at depth. The sour
- Page 242 and 243:
-1'~~ ·/~-IU-'J\·-----'~r-.-;-,~
- Page 244 and 245:
~UMi'.'j~'~Y!lfGIOL~ N ..--Pa.w'rln
- Page 246 and 247:
; ;; Ii; Z II;;; II til, ;;; : i;;
- Page 248 and 249:
Valdez InterimSouthcentral Railbelt
- Page 250 and 251:
LIST OF FIGURES AND TABLESPageFigur
- Page 252 and 253:
-----------------------------------
- Page 254 and 255:
-~~ ~..rt~i~;Valdez Interim ReportS
- Page 256 and 257:
alder, salmonberry, blueberry, and
- Page 258 and 259:
Table IIPrince William Sound Salmon
- Page 260 and 261:
3/ 4/ 5/- - -1976 Average weights b
- Page 262 and 263:
the number of pink salmon counted i
- Page 264 and 265:
in the fall at the upper end of the
- Page 266 and 267:
Table 1 VAllison Creek -Discharge M
- Page 268 and 269:
outlet from the lake; however, the
- Page 270 and 271:
As stated previously, two alternati
- Page 272 and 273:
Discharge measurements are sparse a
- Page 274 and 275:
Streambed sedimentation can be caus
- Page 276 and 277:
8. That during the construction pha
- Page 278 and 279:
LITERATURE CITEDBailey, Jack E., an
- Page 280 and 281:
Sharp-shinned hawk - Accipiter stri
- Page 282 and 283: Allison ereekTemperature DataDateTe
- Page 284 and 285: ALLISON CREEKSeptember 1979 . Octob
- Page 286 and 287: ALLISON CREEKDecember 1979 Januarl
- Page 288 and 289: SOLOMON. CREEKSeEtember 1979 Octobe
- Page 290 and 291: 7. That clearing for the penstock c
- Page 292 and 293: 22. That a cooperative study of the
- Page 294 and 295: APPENDIX IMARKETABILITY REPORT
- Page 296 and 297: Department Of EnergyAlaska Power Ad
- Page 298 and 299: Valdez/Glennallen Power Market Anal
- Page 300 and 301: List of·Tab1esTableIII-1IV-1IV-2V-
- Page 302 and 303: Valdez/Glennallen Power Market Anal
- Page 304 and 305: CHAPTER IISUMMARYValdez and Glennal
- Page 306 and 307: A. Assuming Allison Creek follows S
- Page 308 and 309: CHAPTER IIIPOWER MARKET DESCRIPTION
- Page 310 and 311: increases. Municipal construction h
- Page 312 and 313: CHAPTER IVEXISTING POWER SYSTEMSSys
- Page 314 and 315: TABLE IV-1HISTORICAL LOADS--VALDEZ
- Page 316 and 317: Load FactorsThe following chart lis
- Page 318 and 319: CHAPTER VFUTURE POWER AND ENERGY AS
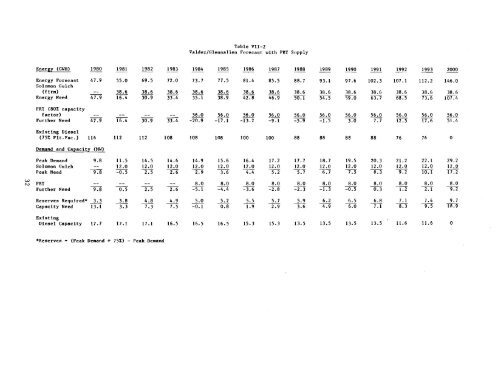
- Page 320 and 321: Table V-IVALDEZ/GLENNALLEN AREA UTI
- Page 322 and 323: Table V-2INSTALLED CAPACITY REQUIRE
- Page 324 and 325: CHAPTER VI .ALTERNATIVE GENERATION
- Page 326 and 327: Biomass-FiredAlthough of many forms
- Page 328 and 329: A Solomon Gulch article in the Dece
- Page 330 and 331: Net EnergyThis section discusses th
- Page 334 and 335: 40VALDEZ/GLENNALLENCAPACITY/RESOURC
- Page 336 and 337: 150Figure VII-3140VALDEZ/GLENNALLEN
- Page 338 and 339: 150·Figure VII-5140VALDEZ/GLENNALL
- Page 340 and 341: TABLE VIII-IASummary Cost EstimateO
- Page 342 and 343: TABLE VIII-2Summary Cost EstimatePr
- Page 344 and 345: Table VIII-3AAverage Rate Determina
- Page 346 and 347: Table VIII-4CVEA Diesel Generation
- Page 348 and 349: Table VIII-5Average Rate Comparison
- Page 350 and 351: Table VIII-6Average Rate Determinat
- Page 352 and 353: Table VIII-8Average Rate Determinat
- Page 354 and 355: Table VIII-IOAverage Rate Determina
- Page 356 and 357: ----~------T'lble VIII-J 1Average R
- Page 358 and 359: CHAPTER IXBIBLIOGRAPHY1. Power Cost
- Page 360 and 361: : I,B'III Ii ::1: iii,APPENDIX JPUB
- Page 362 and 363: Recipents of Valdez Draft Interim f
- Page 364 and 365: u. s. ENVIRONMENTAL PROTECTION AGEN
- Page 366 and 367: 25. ~e str?ngly recOTmend that an a
- Page 368 and 369: UNITED STATES DEPARTMENT OF CO!'!ME
- Page 370 and 371: 3. have adequate flows for flushing
- Page 372 and 373: Cnitc:d Srat6 [)c'~,artmcnt of the:
- Page 374 and 375: AdvisoryCouncil OnHistoricPreservat
- Page 376 and 377: Corps Of Engineers - 2 -11/4/80Than
- Page 378 and 379: -2-'2. Most of the State 1 and enco
- Page 380 and 381: -~-The SCH has no objection to this
- Page 382:
ALASKA POWER AUTHORITY333 WEST 4th