- Page 1:
Cape Cod 2012Regional Transportatio
- Page 4:
Table of ContentsChapter 1: Goals &
- Page 9 and 10:
Chapter 1: Table of Contents1. Intr
- Page 11 and 12:
1. IntroductionThis 2012 Cape Cod R
- Page 13 and 14:
1.1 TRANSPORTATION PLANNING PROCESS
- Page 15 and 16:
RTPRegionalTransportationPlanTIPTra
- Page 18 and 19:
consistent as traffic congestion wa
- Page 20 and 21:
time in. The following table presen
- Page 22 and 23:
especially important are the existe
- Page 24 and 25: Regional Transportation Plan is dev
- Page 26 and 27: Goal #2:Optimize travel time throug
- Page 28 and 29: Where possible, work to consolidate
- Page 30 and 31: Comply with state and federal envir
- Page 32 and 33: 1.4.7 EQUITABILITYTransportation is
- Page 34 and 35: 1.5 CHANGES SINCE THE 2007 PLANThis
- Page 36 and 37: 1.6 COMPARING GOALS WITH OTHER PLAN
- Page 38 and 39: TABLE 5 - GOALS COMPARED: MASSACHUS
- Page 40 and 41: Census. The most recent estimates h
- Page 42 and 43: TABLE 8 - NUMBER OF HOUSEHOLDS AND
- Page 44 and 45: TABLE 10 - RESIDENTS AGED 12-21 ON
- Page 46 and 47: TABLE 11 - MEDIAN HOUSEHOLD INCOME
- Page 48 and 49: TABLE 12 - RESIDENTS LIVING AND WOR
- Page 50 and 51: TABLE 13 - BARNSTABLE COUNTY EMPLOY
- Page 52 and 53: FIGURE 9 - NET DIFFERENCE OF WORKER
- Page 54 and 55: 1.7.3.1. HousingHousing is not only
- Page 56 and 57: 1.7.3.3. Commercial and IndustrialC
- Page 58 and 59: 1.7.4 ENVIRONMENTAL JUSTICE LFIGURE
- Page 60 and 61: Chapter 1: Goals & Objectives Cape
- Page 63 and 64: Chapter 2: Table of Contents2.1 - L
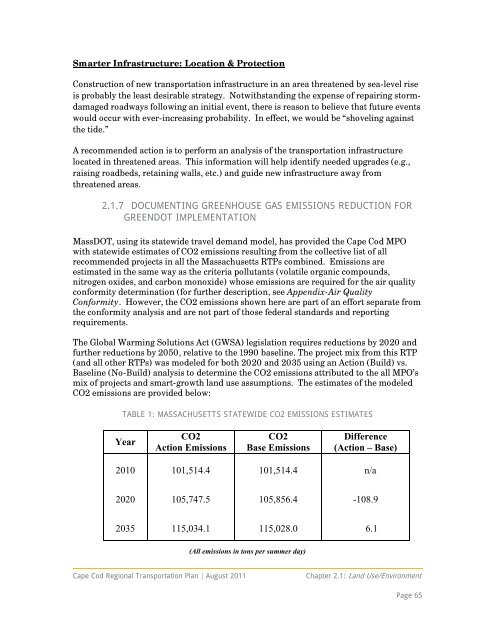
- Page 65 and 66: 2.1 LAND USE AND THE ENVIRONMENTThe
- Page 67 and 68: FIGURE 1 - LAND USE VISION MAPCape
- Page 69 and 70: Much of the corridor remains reside
- Page 71 and 72: The Cape Cod Commission’s Geograp
- Page 73: FIGURE 4 - POTENTIAL EFFECTS OF SEA
- Page 77 and 78: 2.2 ROAD TRANSPORTATIONRoads are an
- Page 79 and 80: FIGURE 3 - ROADWAY INFRASTRUCTURESo
- Page 81 and 82: TABLE 2 - ROAD MILEAGE BY JURISDICT
- Page 83 and 84: 2.2.3 SPEED LIMITSThe maximum legal
- Page 85 and 86: TABLE 5 - CAPE COD SUMMER TRAFFIC G
- Page 87 and 88: 2.2.5 LEVEL OF SERVICELevel of Serv
- Page 89 and 90: FIGURE 10 - ESTIMATED ROADWAY LEVEL
- Page 91 and 92: MassDOT evaluates roads under their
- Page 93 and 94: households on automobiles is due to
- Page 95 and 96: 2.2.8 COMMUTER TRAFFICOn average 20
- Page 97 and 98: The following table lists for each
- Page 99 and 100: The following figure graphically sh
- Page 101 and 102: FIGURE 18: LICENSE PLATE STUDY: MA
- Page 103 and 104: 2.2.10 FREIGHT TRAFFICThis section
- Page 105 and 106: FIGURE 22 - ESTIMATED AVERAGE ANNUA
- Page 107 and 108: TABLE 10 - BRIDGE CONDITIONS OF CAP
- Page 109 and 110: FIGURE 24 - THE NORTHERN CROSSING O
- Page 111 and 112: The Sagamore Rotary, located north
- Page 113 and 114: crossovers from one direction of tr
- Page 115 and 116: to accommodate high levels of traff
- Page 117 and 118: Land UseFIGURE 31: ROUTE 6 LIMITED
- Page 119 and 120: Palmer Avenue, Falmouth to Orleans
- Page 121 and 122: FIGURE 36 - ROUTE 28 EAST OF ROUTES
- Page 123 and 124: 2.2.14 ROUTE 6ARoute 6A on Cape Cod
- Page 125 and 126:
TownTABLE 14- TRAFFIC VOLUMES & MIL
- Page 127 and 128:
2.3 BUS TRANSPORTATIONFIGURE 1: BUS
- Page 129 and 130:
2.3.1 HYANNIS TRANSPORTATION CENTER
- Page 131 and 132:
FIGURE 6: TAXI PICK-UP AND DROP OFF
- Page 133 and 134:
2.3.2.2 Falmouth Bus DepotThe Falmo
- Page 135 and 136:
FIGURE 9: AERIAL VIEW OF THE SAGAMO
- Page 137 and 138:
The lot experiences heavy usage, of
- Page 139 and 140:
Current Plymouth and Brockton servi
- Page 141 and 142:
2.3.4.2 Bonanza Bus Lines / Peter P
- Page 143 and 144:
FIGURE 19: PETER PAN / BONANZA BUS
- Page 145 and 146:
TABLE 6: FUNDING FOR OPERATIONS BY
- Page 147 and 148:
TABLE 8: PERFORMANCE MEASURES FOR C
- Page 149 and 150:
$25.001,000,000900,000Expense in Do
- Page 151 and 152:
2.3.6.1 Hyannis-Falmouth Service:
- Page 153 and 154:
2.3.6.2 Hyannis-Orleans Service:
- Page 155 and 156:
2.3.6.3 Barnstable VillagerFIGURE 2
- Page 157 and 158:
TABLE 12: HYANNIS SHUTTLE RIDERSHIP
- Page 159 and 160:
TABLE 14: WHOOSH TROLLEY RIDERSHIP,
- Page 161 and 162:
2.3.8 FLEXIBLE ROUTE BUS SERVICE:
- Page 163 and 164:
FIGURE 33: A FLEX BUS PARKED AT THE
- Page 165 and 166:
Local bus transit services cover ke
- Page 167 and 168:
FIGURE 36: ENVIRONMENTAL JUSTICE PO
- Page 169 and 170:
The transit needs of the elderly mu
- Page 171 and 172:
2.3.11 CAPE COD REGIONAL TRANSIT AU
- Page 173 and 174:
through a coordinated service of hu
- Page 175 and 176:
2.4 RAIL TRANSPORTATIONRail Transpo
- Page 177 and 178:
Wareham, Buzzards Bay, and Sandwich
- Page 179 and 180:
FIGURE 4: RAIL TRACKS LEADING SOUTH
- Page 181 and 182:
FIGURE 11: AN OUT OF SERVICE TRACK
- Page 183 and 184:
2.4.2.2 Hyannis BranchThe Hyannis B
- Page 185 and 186:
FIGURE 22: RAIL TRACKS AT THE OTISJ
- Page 187 and 188:
ailroad bridge. The new bridge was
- Page 189 and 190:
2.4.3 SIGNALS AND CROSSINGSTABLE 2:
- Page 191 and 192:
FIGURE 33: MASS COASTAL ENERGY TRAI
- Page 193 and 194:
TABLE 3: ENGINES IN THE CAPE COD CE
- Page 195 and 196:
for the construction of rail tracks
- Page 197 and 198:
2.5 WATER TRANSPORTATIONThe primary
- Page 199 and 200:
2.5.1.2 Hyannis HarborFIGURE 5: HYA
- Page 201 and 202:
the channel in 1916 and deepened it
- Page 203 and 204:
FIGURE 9: BARNSTABLE HARBOR AND MAR
- Page 205 and 206:
an anchorage of 6-7 feet (Figure 12
- Page 207 and 208:
Responsibility for the Cape Cod Can
- Page 209 and 210:
FIGURE 20: WOODS HOLE CHANNELWoods
- Page 211 and 212:
FIGURE 21: NANTUCKET SOUND CHANNELS
- Page 213 and 214:
TABLE 3: ACTIVE CAPE COD LIGHTHOUSE
- Page 215 and 216:
TABLE 5: FREIGHT TRAFFIC THROUGH CA
- Page 217 and 218:
Trucks Ferried between Cape Cod and
- Page 219 and 220:
FIGURE 24: CAPE COD FERRY SERVICE2.
- Page 221 and 222:
3,500Total Steamship Authority Pass
- Page 223 and 224:
and Oak Bluffs. A year later Hyanni
- Page 225 and 226:
of trips per year. Travelers can al
- Page 227 and 228:
is Harwichport. Clearly, increasing
- Page 229 and 230:
2.6 AIR TRANSPORTATIONAir transport
- Page 231 and 232:
Several other airports are open to
- Page 233 and 234:
5/23 2035’ Turf - Good: - - -x 50
- Page 235 and 236:
2.6.3 AIR SERVICE ACCESSIBILITY AND
- Page 237 and 238:
2.7 CANAL AREA TRANSPORTATIONAlmost
- Page 239 and 240:
FIGURE 1 - BOURNE BRIDGEFIGURE 2 -
- Page 241 and 242:
2.7.3 HIGHWAY BRIDGE CAPACITYAccord
- Page 243 and 244:
FIGURE 6 - DIFFERENCE BETWEEN SUMME
- Page 245 and 246:
TABLE 1 - CAPE COD CANAL BRIDGES TR
- Page 247 and 248:
In calculating the backups and dela
- Page 249 and 250:
FIGURE 8 - CROSS-CANAL TRAFFIC, EST
- Page 251 and 252:
FIGURE 10 - SAGAMORE INTERCHANGE DI
- Page 253 and 254:
2.7.7.1 Scenic HighwayScenic Highwa
- Page 255 and 256:
2.7.7.2 Sandwich RoadSandwich Road
- Page 257 and 258:
FIGURE 17 - SIGNS DIRECTING MOTORIS
- Page 259 and 260:
FIGURE 19 - ROUTE 3 CONGESTION AT T
- Page 261 and 262:
2.7.8 RAILROAD BRIDGEThe third brid
- Page 263 and 264:
2.8 SUB-REGIONAL ISSUESEach town, v
- Page 265 and 266:
egional corridors serve as a networ
- Page 267 and 268:
2.8.2 MID-CAPEThe Mid-Cape includes
- Page 269 and 270:
Air ServiceThis region contains the
- Page 271 and 272:
edevelopment or new development alo
- Page 273 and 274:
additional bike facilities exist. T
- Page 275 and 276:
Roadway NetworkThe main road in the
- Page 277:
2012 REGIONAL TRANSPORTATION PLANCh
- Page 280 and 281:
3.7 - Cape Cod Commission’s Locat
- Page 282 and 283:
TABLE 1 - RTP LOCAL SAFETY PROBLEM
- Page 284 and 285:
In an effort to create a more robus
- Page 286 and 287:
TABLE 3 - TOP LOCATIONS BASED ON EQ
- Page 288 and 289:
TABLE 5 - TOP LOCATIONS BASED ON EP
- Page 290 and 291:
Another dimension defining the uniq
- Page 292 and 293:
Considering protected left turn pha
- Page 294 and 295:
TABLE 7 - CRASH RATES (BASED ON YEA
- Page 296 and 297:
TABLE 9 - CRASH RATES (BASED ON YEA
- Page 298 and 299:
FIGURE 4 - COMPARISON OF PREDICTED
- Page 300 and 301:
collectively address the Commonweal
- Page 302 and 303:
Safety Project Selection ProcessThr
- Page 304 and 305:
3.3.5 COMMUNITY CHARACTER/SAFETY IS
- Page 306 and 307:
adjacent intersection of Old Stage
- Page 308 and 309:
noted, this was discussed previousl
- Page 310 and 311:
Safety Issue #9. Presence of Utilit
- Page 312 and 313:
Safety Issue #6. Pedestrian Accommo
- Page 314 and 315:
motorists. To further enhance the d
- Page 316 and 317:
3.4.3.2 Great Neck Road North/Old B
- Page 318 and 319:
Safety Issue #3. Asa Meiggs RoadEnh
- Page 320 and 321:
Safety Issue #1. Intersection Geome
- Page 322 and 323:
TABLE 10 - INJURIES FROM COLLISIONS
- Page 324 and 325:
3.5.3 PEDESTRIAN SAFETYPedestrians
- Page 326 and 327:
Support additional enforcement and
- Page 328 and 329:
located throughout the state and ar
- Page 330 and 331:
on Rock Harbor Road have no warning
- Page 332 and 333:
As this road is an important bicycl
- Page 334 and 335:
Chapter 3: Safety Cape Cod Regional
- Page 337 and 338:
Chapter 4: Table of Contents4 Secur
- Page 339 and 340:
4. SecurityConcern over security is
- Page 341 and 342:
One method that can be used to impr
- Page 343 and 344:
FIGURE 2 - LOCATION OF EMERGENCY SH
- Page 345 and 346:
Security Problem Identification8. A
- Page 347 and 348:
Transportation System (under design
- Page 349:
2012 REGIONAL TRANSPORTATION PLANCh
- Page 352 and 353:
Figure 14 - Setucket Road Path East
- Page 354 and 355:
Chapter 5: Bike & Pedestrian Cape C
- Page 356 and 357:
and provide connections between the
- Page 358 and 359:
5.1 BICYCLE AND PEDESTRIAN TRANSPOR
- Page 360 and 361:
should have a paved surface 8-10 fe
- Page 362 and 363:
5.1.1.2 Cape Cod Canal Bike PathsTh
- Page 364 and 365:
portion south of Mayfair Street is
- Page 366 and 367:
FIGURE 16 - MAP OF NICKERSON STATE
- Page 368 and 369:
owned by the Cape Cod National Seas
- Page 370 and 371:
5.1.1.11 Old Townhouse Road TrailTh
- Page 372 and 373:
FIGURE 27 - FOREST ROAD PATH, LOOKI
- Page 374 and 375:
5.1.1.16 Forestdale School PathThe
- Page 376 and 377:
5.1.2.2 State Bicycle RoutesMassGIS
- Page 378 and 379:
FIGURE 31 - LOW VOLUME ROADSChapter
- Page 380 and 381:
of concrete, paved asphalt, bricks,
- Page 382 and 383:
FIGURE 33 - CAPE COD PATHWAYS5.1.5
- Page 384 and 385:
FIGURE 34 - WEST YARMOUTH ROADCROSS
- Page 386 and 387:
FIGURE 37 - ROUTE "6B" - NORTHSIDE
- Page 388 and 389:
FIGURE 40 - POTENTIAL ROUTE "6B" IN
- Page 390 and 391:
FIGURE 43 - POTENTIAL ROUTE "6B" IN
- Page 392 and 393:
FIGURE 46 - POTENTIAL ROUTE "28B" I
- Page 394 and 395:
FIGURE 49 - POTENTIAL ROUTE "28B" I
- Page 396 and 397:
5.3 RECENT & ONGOING BICYCLE/PEDEST
- Page 398 and 399:
5.3.2 HARWICH BICYCLE/PEDESTRIAN/TR
- Page 400 and 401:
5.3.3 BARNSTABLEThe town of Barnsta
- Page 402 and 403:
5.3.4 DENNISPORT REVITALIZATION MAS
- Page 404 and 405:
FIGURE 57 - ORLEANS ROUTE 28 BIKEWA
- Page 406 and 407:
5.4 CCNS INTEGRATED BICYCLE PLAN FO
- Page 408 and 409:
towns and destinations, and close g
- Page 410 and 411:
Continuity in access to over 40 mil
- Page 412 and 413:
Sign design, content, placement sta
- Page 414 and 415:
• Possible alternate routes (that
- Page 416 and 417:
which would result in a CCRT alignm
- Page 418 and 419:
equired on Old Queen Anne Road for
- Page 420 and 421:
Cost Estimate - Shared-use path, un
- Page 422 and 423:
and facilities needed. A corridor a
- Page 424 and 425:
Preliminary Design Concepts - Desig
- Page 426 and 427:
Route 6 is a principal arterial tha
- Page 428 and 429:
On-road improvements, unit costs pe
- Page 430 and 431:
heaviest pedestrian movements are l
- Page 432 and 433:
Route 6A in many locations. In deve
- Page 434 and 435:
access the rail trails. Shoulder wi
- Page 436 and 437:
On-roadway accommodations, shared-u
- Page 438 and 439:
accommodations and safety counterme
- Page 440 and 441:
Project 5.3.15: Connect Shawme-Crow
- Page 442 and 443:
would allow access without the need
- Page 444 and 445:
Project 5.3.19 Improve Bicycling Co
- Page 446 and 447:
popular destinations. Sidewalks or
- Page 448 and 449:
y bicycle including recreation feat
- Page 450 and 451:
Project 5.4.2: Establish Nonprofit
- Page 452 and 453:
Project 5.4.5: Safety Education & O
- Page 454 and 455:
website. MassBike, other bicycle ad
- Page 456 and 457:
ProjectTABLE 3 - LIST OF MAPPED PRO
- Page 458 and 459:
FIGURE 60 - CCNS LOWER/OUTER-CAPE M
- Page 460 and 461:
FIGURE 62 - CCNS LOWER/OUTER-CAPE P
- Page 462 and 463:
Chapter 5: Bike & Pedestrian Cape C
- Page 465 and 466:
Chapter 6: Table of Contents6. Cong
- Page 467 and 468:
6. Congestion ManagementAny urban a
- Page 469 and 470:
Air Quality Non-attainment AreasIn
- Page 471 and 472:
The philosophy of the Cape Cod RTP
- Page 473 and 474:
Cape Cod Canal BridgesYarmouth Road
- Page 475 and 476:
FIGURE 1 - CONGESTION MANAGEMENT WE
- Page 477 and 478:
6.8. EXISTING CONGESTION INDICATORS
- Page 479 and 480:
FIGURE 4 - ANNUAL AVERAGE DAILY TRA
- Page 481 and 482:
FIGURE 5 - UPPER CAPE COD V/C RATIO
- Page 483 and 484:
FIGURE 7 - OUTER CAPE COD V/C RATIO
- Page 485 and 486:
measures local and regional (on-Cap
- Page 487:
2012 REGIONAL TRANSPORTATION PLANCh
- Page 490 and 491:
Table 8 - Smart Solutions Considere
- Page 492 and 493:
A full listing of all Programs is a
- Page 494 and 495:
2010 2017 2020 2025 2030 2035(actua
- Page 496 and 497:
TABLE 3 - EMPLOYMENT FORECASTS BY T
- Page 498 and 499:
MassDOT’s guide suggests that Sys
- Page 500 and 501:
A transportation project may have b
- Page 502 and 503:
FIGURE 1 - YARMOUTH ROAD CONCEPT 1A
- Page 504 and 505:
mission as the original plan, using
- Page 506 and 507:
since it is usually intermittent or
- Page 508 and 509:
FIGURE 3 - INTERSECTION OF ROUTE 6A
- Page 510 and 511:
FIGURE 5 - "SHARROW" PAVEMENT MARKI
- Page 512 and 513:
time vehicle locations will be used
- Page 514 and 515:
The study report has presented an o
- Page 516 and 517:
description of the systems of inter
- Page 518 and 519:
Transportation Programs;Transportat
- Page 520 and 521:
Printed: 6/13/2011 Programs Cape Co
- Page 522 and 523:
Printed: 6/14/2011 Projects Cape Co
- Page 524 and 525:
Printed: 6/14/2011 Projects Cape Co
- Page 526 and 527:
Printed: 6/14/2011 Projects Cape Co
- Page 528 and 529:
Printed: 6/14/2011 Projects Cape Co
- Page 530 and 531:
Printed: 6/14/2011 Projects Cape Co
- Page 532 and 533:
Printed: 6/13/2011 Smart Solutions
- Page 534 and 535:
7.6.4 TRANSPORTATION STUDIES CONSID
- Page 536 and 537:
Printed: 6/13/2011 Studies Cape Cod
- Page 538 and 539:
Chapter 7: Alternatives Cape Cod Re
- Page 541 and 542:
Chapter 8: Table of Contents8. Reco
- Page 543 and 544:
8. Recommendations and Financial Pl
- Page 545 and 546:
portion of service operating costs
- Page 547 and 548:
Federal Transit Administration Prog
- Page 549 and 550:
This section is to provide an overv
- Page 551 and 552:
TABLE 1 - FFY 2012-2035 ESTIMATED R
- Page 553 and 554:
8.6 RECOMMENDATIONS WITHIN AVAILABL
- Page 555 and 556:
The Cape Cod Region has worked coop
- Page 557:
8.7 CONCLUSIONThe recommended prior
- Page 561 and 562:
Air Quality ConformityINTRODUCTIONT
- Page 563 and 564:
evaluate the TIPs’ air quality im
- Page 565 and 566:
and future population, households,
- Page 567 and 568:
The Draft RTP will be made availabl
- Page 569 and 570:
2010 HPMS Travel Demand HPMS/ModelM
- Page 571 and 572:
A complete listing of future region
- Page 573 and 574:
2016 Fitchburg/Westminst New Wachus
- Page 575 and 576:
TABLE 1: VOC EMISSIONS ESTIMATES FO
- Page 577:
2012 REGIONAL TRANSPORTATION PLANAp
- Page 581 and 582:
GeneralDocument referred to as “2
- Page 583 and 584:
Section 3.4 Roadway Safety Audits (