- Page 2:
This page intentionally left blank
- Page 6:
Editorial Director: Sally Yagan Edi
- Page 10:
To Joy, Forest, Byron, and Meredith
- Page 14:
This page intentionally left blank
- Page 18:
This page intentionally left blank
- Page 22:
x CONTENTS Industry Analysis: The E
- Page 26:
xii CONTENTS Part 4 Strategy Evalua
- Page 30:
xiv CONTENTS Cases HOSPITALITY/ENTE
- Page 34:
This page intentionally left blank
- Page 38:
xviii PREFACE issues and concerns.
- Page 42:
xx PREFACE current strategic-manage
- Page 46:
This page intentionally left blank
- Page 50:
xxiv ACKNOWLEDGMENTS with overly ag
- Page 54:
This page intentionally left blank
- Page 58:
xxviii CASE COMPANY INFORMATION MAT
- Page 62:
xxx CASE COMPANY INFORMATION MATRIX
- Page 66:
This page intentionally left blank
- Page 70:
PART 1 Overview of Strategic Manage
- Page 74:
4 PART 1 • OVERVIEW OF STRATEGIC
- Page 78:
6 PART 1 • OVERVIEW OF STRATEGIC
- Page 82:
8 PART 1 • OVERVIEW OF STRATEGIC
- Page 86:
10 PART 1 • OVERVIEW OF STRATEGIC
- Page 90:
12 PART 1 • OVERVIEW OF STRATEGIC
- Page 94:
14 PART 1 • OVERVIEW OF STRATEGIC
- Page 98:
16 PART 1 • OVERVIEW OF STRATEGIC
- Page 102:
18 PART 1 • OVERVIEW OF STRATEGIC
- Page 106:
20 PART 1 • OVERVIEW OF STRATEGIC
- Page 110:
22 PART 1 • OVERVIEW OF STRATEGIC
- Page 114:
24 PART 1 • OVERVIEW OF STRATEGIC
- Page 118:
26 PART 1 • OVERVIEW OF STRATEGIC
- Page 122:
28 PART 1 • OVERVIEW OF STRATEGIC
- Page 126:
30 PART 1 • OVERVIEW OF STRATEGIC
- Page 130:
32 PART 1 • OVERVIEW OF STRATEGIC
- Page 134:
34 PART 1 • OVERVIEW OF STRATEGIC
- Page 138:
36 PART 1 • OVERVIEW OF STRATEGIC
- Page 142:
38 PART 1 • OVERVIEW OF STRATEGIC
- Page 146:
PART 2 Strategy Formulation CHAPTER
- Page 150:
42 PART 2 • STRATEGY FORMULATION
- Page 154:
44 PART 2 • STRATEGY FORMULATION
- Page 158:
46 PART 2 • STRATEGY FORMULATION
- Page 162:
48 PART 2 • STRATEGY FORMULATION
- Page 166:
50 PART 2 • STRATEGY FORMULATION
- Page 170:
52 PART 2 • STRATEGY FORMULATION
- Page 174:
54 PART 2 • STRATEGY FORMULATION
- Page 178:
56 PART 2 • STRATEGY FORMULATION
- Page 182:
CHAPTER 3 The External Assessment C
- Page 186:
60 PART 2 • STRATEGY FORMULATION
- Page 190:
62 PART 2 • STRATEGY FORMULATION
- Page 194:
64 PART 2 • STRATEGY FORMULATION
- Page 198:
66 PART 2 • STRATEGY FORMULATION
- Page 202:
68 PART 2 • STRATEGY FORMULATION
- Page 206:
70 PART 2 • STRATEGY FORMULATION
- Page 210:
72 PART 2 • STRATEGY FORMULATION
- Page 214:
74 PART 2 • STRATEGY FORMULATION
- Page 218:
76 PART 2 • STRATEGY FORMULATION
- Page 222:
78 PART 2 • STRATEGY FORMULATION
- Page 226:
80 PART 2 • STRATEGY FORMULATION
- Page 230:
82 PART 2 • STRATEGY FORMULATION
- Page 234:
84 PART 2 • STRATEGY FORMULATION
- Page 238:
86 PART 2 • STRATEGY FORMULATION
- Page 242:
88 PART 2 • STRATEGY FORMULATION
- Page 246:
CHAPTER 4 The Internal Assessment C
- Page 250:
92 PART 2 • STRATEGY FORMULATION
- Page 254:
94 PART 2 • STRATEGY FORMULATION
- Page 258:
96 PART 2 • STRATEGY FORMULATION
- Page 262:
98 PART 2 • STRATEGY FORMULATION
- Page 266:
100 PART 2 • STRATEGY FORMULATION
- Page 270:
102 PART 2 • STRATEGY FORMULATION
- Page 274:
104 PART 2 • STRATEGY FORMULATION
- Page 278:
106 PART 2 • STRATEGY FORMULATION
- Page 282:
108 PART 2 • STRATEGY FORMULATION
- Page 286:
110 PART 2 • STRATEGY FORMULATION
- Page 290:
112 PART 2 • STRATEGY FORMULATION
- Page 294:
114 PART 2 • STRATEGY FORMULATION
- Page 298:
116 PART 2 • STRATEGY FORMULATION
- Page 302:
118 PART 2 • STRATEGY FORMULATION
- Page 306:
120 PART 2 • STRATEGY FORMULATION
- Page 310:
122 PART 2 • STRATEGY FORMULATION
- Page 314:
124 PART 2 • STRATEGY FORMULATION
- Page 318:
126 PART 2 • STRATEGY FORMULATION
- Page 322:
128 PART 2 • STRATEGY FORMULATION
- Page 326:
CHAPTER 5 Strategies in Action CHAP
- Page 330:
132 PART 2 • STRATEGY FORMULATION
- Page 334:
134 PART 2 • STRATEGY FORMULATION
- Page 338:
136 PART 2 • STRATEGY FORMULATION
- Page 342:
138 PART 2 • STRATEGY FORMULATION
- Page 346:
140 PART 2 • STRATEGY FORMULATION
- Page 350:
142 PART 2 • STRATEGY FORMULATION
- Page 354:
144 PART 2 • STRATEGY FORMULATION
- Page 358:
146 PART 2 • STRATEGY FORMULATION
- Page 362:
148 PART 2 • STRATEGY FORMULATION
- Page 366:
150 PART 2 • STRATEGY FORMULATION
- Page 370:
152 PART 2 • STRATEGY FORMULATION
- Page 374:
154 PART 2 • STRATEGY FORMULATION
- Page 378:
156 PART 2 • STRATEGY FORMULATION
- Page 382:
158 PART 2 • STRATEGY FORMULATION
- Page 386:
160 PART 2 • STRATEGY FORMULATION
- Page 390:
162 PART 2 • STRATEGY FORMULATION
- Page 394:
164 PART 2 • STRATEGY FORMULATION
- Page 398:
166 PART 2 • STRATEGY FORMULATION
- Page 402:
168 PART 2 • STRATEGY FORMULATION
- Page 406:
170 PART 2 • STRATEGY FORMULATION
- Page 410:
CHAPTER 6 Strategy Analysis and Cho
- Page 414:
174 PART 2 • STRATEGY FORMULATION
- Page 418:
176 PART 2 • STRATEGY FORMULATION
- Page 422:
178 PART 2 • STRATEGY FORMULATION
- Page 426:
180 PART 2 • STRATEGY FORMULATION
- Page 430:
182 PART 2 • STRATEGY FORMULATION
- Page 434:
184 PART 2 • STRATEGY FORMULATION
- Page 438:
186 PART 2 • STRATEGY FORMULATION
- Page 442:
188 PART 2 • STRATEGY FORMULATION
- Page 446:
190 PART 2 • STRATEGY FORMULATION
- Page 450:
192 PART 2 • STRATEGY FORMULATION
- Page 454:
194 PART 2 • STRATEGY FORMULATION
- Page 458:
196 PART 2 • STRATEGY FORMULATION
- Page 462:
198 PART 2 • STRATEGY FORMULATION
- Page 466:
200 PART 2 • STRATEGY FORMULATION
- Page 470:
202 PART 2 • STRATEGY FORMULATION
- Page 474:
204 PART 2 • STRATEGY FORMULATION
- Page 478:
206 PART 2 • STRATEGY FORMULATION
- Page 482:
208 PART 2 • STRATEGY FORMULATION
- Page 486:
PART 3 Strategy Implementation CHAP
- Page 490:
212 PART 3 • STRATEGY IMPLEMENTAT
- Page 494:
214 PART 3 • STRATEGY IMPLEMENTAT
- Page 498:
216 PART 3 • STRATEGY IMPLEMENTAT
- Page 502:
218 PART 3 • STRATEGY IMPLEMENTAT
- Page 506:
220 PART 3 • STRATEGY IMPLEMENTAT
- Page 510:
222 PART 3 • STRATEGY IMPLEMENTAT
- Page 514:
224 PART 3 • STRATEGY IMPLEMENTAT
- Page 518:
226 PART 3 • STRATEGY IMPLEMENTAT
- Page 522:
228 PART 3 • STRATEGY IMPLEMENTAT
- Page 526:
230 PART 3 • STRATEGY IMPLEMENTAT
- Page 530:
232 PART 3 • STRATEGY IMPLEMENTAT
- Page 534:
234 PART 3 • STRATEGY IMPLEMENTAT
- Page 538:
236 PART 3 • STRATEGY IMPLEMENTAT
- Page 542:
238 PART 3 • STRATEGY IMPLEMENTAT
- Page 546:
240 PART 3 • STRATEGY IMPLEMENTAT
- Page 550:
242 PART 3 • STRATEGY IMPLEMENTAT
- Page 554:
244 PART 3 • STRATEGY IMPLEMENTAT
- Page 558:
246 PART 3 • STRATEGY IMPLEMENTAT
- Page 562:
248 PART 3 • STRATEGY IMPLEMENTAT
- Page 566:
CHAPTER 8 Implementing Strategies:
- Page 570:
252 PART 3 • STRATEGY IMPLEMENTAT
- Page 574:
254 PART 3 • STRATEGY IMPLEMENTAT
- Page 578:
256 PART 3 • STRATEGY IMPLEMENTAT
- Page 582:
258 PART 3 • STRATEGY IMPLEMENTAT
- Page 586:
260 PART 3 • STRATEGY IMPLEMENTAT
- Page 590:
262 PART 3 • STRATEGY IMPLEMENTAT
- Page 594:
264 PART 3 • STRATEGY IMPLEMENTAT
- Page 598:
266 PART 3 • STRATEGY IMPLEMENTAT
- Page 602:
268 PART 3 • STRATEGY IMPLEMENTAT
- Page 606:
270 PART 3 • STRATEGY IMPLEMENTAT
- Page 610:
272 PART 3 • STRATEGY IMPLEMENTAT
- Page 614:
274 PART 3 • STRATEGY IMPLEMENTAT
- Page 618:
276 PART 3 • STRATEGY IMPLEMENTAT
- Page 622:
278 PART 3 • STRATEGY IMPLEMENTAT
- Page 626:
280 PART 3 • STRATEGY IMPLEMENTAT
- Page 630:
282 PART 3 • STRATEGY IMPLEMENTAT
- Page 634:
PART 4 Strategy Evaluation CHAPTER
- Page 638:
286 PART 4 • STRATEGY EVALUATION
- Page 642:
288 PART 4 • STRATEGY EVALUATION
- Page 646:
290 PART 4 • STRATEGY EVALUATION
- Page 650:
292 PART 4 • STRATEGY EVALUATION
- Page 654:
294 PART 4 • STRATEGY EVALUATION
- Page 658:
296 PART 4 • STRATEGY EVALUATION
- Page 662:
298 PART 4 • STRATEGY EVALUATION
- Page 666:
300 PART 4 • STRATEGY EVALUATION
- Page 670:
302 PART 4 • STRATEGY EVALUATION
- Page 674:
304 PART 4 • STRATEGY EVALUATION
- Page 678:
306 PART 4 • STRATEGY EVALUATION
- Page 682:
PART 5 Key Strategic-Management Top
- Page 686:
310 PART 5 • KEY STRATEGIC-MANAGE
- Page 690:
312 PART 5 • KEY STRATEGIC-MANAGE
- Page 694:
314 PART 5 • KEY STRATEGIC-MANAGE
- Page 698:
316 PART 5 • KEY STRATEGIC-MANAGE
- Page 702:
318 PART 5 • KEY STRATEGIC-MANAGE
- Page 706:
320 PART 5 • KEY STRATEGIC-MANAGE
- Page 710:
322 PART 5 • KEY STRATEGIC-MANAGE
- Page 714:
324 PART 5 • KEY STRATEGIC-MANAGE
- Page 718:
326 PART 5 • KEY STRATEGIC-MANAGE
- Page 722:
CHAPTER 11 Global/International Iss
- Page 726:
330 PART 5 • KEY STRATEGIC-MANAGE
- Page 730:
332 PART 5 • KEY STRATEGIC-MANAGE
- Page 734:
334 PART 5 • KEY STRATEGIC-MANAGE
- Page 738:
336 PART 5 • KEY STRATEGIC-MANAGE
- Page 742:
338 PART 5 • KEY STRATEGIC-MANAGE
- Page 746:
340 PART 5 • KEY STRATEGIC-MANAGE
- Page 750:
342 PART 5 • KEY STRATEGIC-MANAGE
- Page 754:
344 PART 5 • KEY STRATEGIC-MANAGE
- Page 758:
PART 6 Strategic-Management Case An
- Page 762:
348 PART 6 • STRATEGIC-MANAGEMENT
- Page 766:
350 PART 6 • STRATEGIC-MANAGEMENT
- Page 770:
352 PART 6 • STRATEGIC-MANAGEMENT
- Page 774:
354 PART 6 • STRATEGIC-MANAGEMENT
- Page 778:
356 PART 6 • STRATEGIC-MANAGEMENT
- Page 782:
358 PART 6 • STRATEGIC-MANAGEMENT
- Page 786:
360 INDEX Finkelstein, Sydney, 167
- Page 790:
362 INDEX Thai, Kim, 167, 280 Thomp
- Page 794:
364 INDEX E Economic forces, 63, 33
- Page 798:
366 INDEX Q OSPM, 192-196 Quality (
- Page 802:
This page intentionally left blank
- Page 806:
This page intentionally left blank
- Page 810:
2 MERNOUSH BANTON Disney Consumer P
- Page 814:
4 MERNOUSH BANTON EXHIBIT 3 Consoli
- Page 818:
6 MERNOUSH BANTON Entertainment Ser
- Page 822:
8 MERNOUSH BANTON EXHIBIT 9 Disney
- Page 826:
10 MERNOUSH BANTON EXHIBIT 11 Disne
- Page 830:
12 MERNOUSH BANTON The second large
- Page 834:
2 Merryland Amusement Park — 2009
- Page 838:
16 GREGORY STONE place for area fam
- Page 842:
18 GREGORY STONE EXHIBIT 4 Missouri
- Page 846:
20 GREGORY STONE Tony explored opti
- Page 850:
22 GREGORY STONE EXHIBIT 5 2008 Gen
- Page 854:
24 GREGORY STONE EXHIBIT 6 2008 Kan
- Page 858:
3 JetBlue Airways Corporation — 2
- Page 862:
28 MERNOUSH BANTON hub (Terminal 5
- Page 866:
30 MERNOUSH BANTON EXHIBIT 3 JetBlu
- Page 870:
32 MERNOUSH BANTON expenses rose 8.
- Page 874:
34 MERNOUSH BANTON EXHIBIT 7 Airlin
- Page 878:
36 MERNOUSH BANTON EXHIBIT 12 Airli
- Page 882:
38 CHARLES M. BYLES as a safe airli
- Page 886:
40 CHARLES M. BYLES in a number of
- Page 890:
42 CHARLES M. BYLES EXHIBIT 4 AirTr
- Page 894:
44 CHARLES M. BYLES EXHIBIT 6 Balan
- Page 898:
46 CHARLES M. BYLES shows that labo
- Page 902:
48 CHARLES M. BYLES EXHIBIT 12 JetB
- Page 906:
5 Family Dollar Stores, Inc. — 20
- Page 910:
52 JOSEPH W. LEONARD EXHIBIT 2 Fami
- Page 914:
54 JOSEPH W. LEONARD To support its
- Page 918:
56 JOSEPH W. LEONARD Beyond the fou
- Page 922:
58 JOSEPH W. LEONARD EXHIBIT 8 Fami
- Page 926:
60 AMIT J. SHAH AND MICHAEL L. MONA
- Page 930:
62 AMIT J. SHAH AND MICHAEL L. MONA
- Page 934:
64 AMIT J. SHAH AND MICHAEL L. MONA
- Page 938:
66 AMIT J. SHAH AND MICHAEL L. MONA
- Page 942:
68 AMIT J. SHAH AND MICHAEL L. MONA
- Page 946:
70 AMIT J. SHAH AND MICHAEL L. MONA
- Page 950:
72 AMIT J. SHAH AND MICHAEL L. MONA
- Page 954:
74 JAMES L. HARBIN AND PATRICIA HUM
- Page 958:
76 JAMES L. HARBIN AND PATRICIA HUM
- Page 962:
78 JAMES L. HARBIN AND PATRICIA HUM
- Page 966:
80 JAMES L. HARBIN AND PATRICIA HUM
- Page 970:
82 JAMES L. HARBIN AND PATRICIA HUM
- Page 974:
84 ROCHELLE R. BRUNSON AND MARLENE
- Page 978:
86 ROCHELLE R. BRUNSON AND MARLENE
- Page 982:
88 ROCHELLE R. BRUNSON AND MARLENE
- Page 986: 90 ROCHELLE R. BRUNSON AND MARLENE
- Page 990: 92 HAMID KAZEROONY The Web site sta
- Page 994: 94 HAMID KAZEROONY EXHIBIT 2 Consol
- Page 998: 96 HAMID KAZEROONY EXHIBIT 6 Search
- Page 1002: 98 HAMID KAZEROONY EXHIBIT 8 Top 25
- Page 1006: 100 LORI RADULOVICH EBay Inc. encom
- Page 1010: 102 LORI RADULOVICH A Trusted Onlin
- Page 1014: 104 LORI RADULOVICH The success of
- Page 1018: 106 LORI RADULOVICH ruled that eBay
- Page 1022: 108 LORI RADULOVICH EXHIBIT 4 eBay
- Page 1026: 110 LORI RADULOVICH EXHIBIT 7 eBay
- Page 1030: 112 DONALD L. CROOKS, ROBERT S. GOO
- Page 1034: 114 DONALD L. CROOKS, ROBERT S. GOO
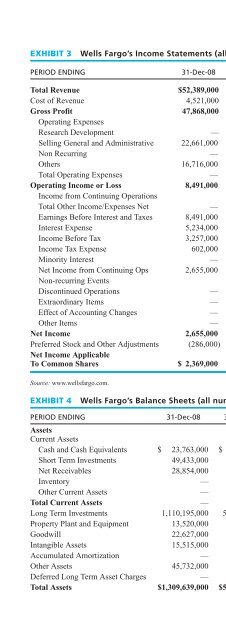
- Page 1040: EXHIBIT 5 Wells Fargo—Business Se
- Page 1044: EXHIBIT 7 Wells Fargo versus Rivals
- Page 1048: high-quality southern-style doughnu
- Page 1052: contain a doughnut-making productio
- Page 1056: Mission and Vision The current comp
- Page 1060: All stores are required to have a s
- Page 1064: 13 Starbucks Corporation — 2009 S
- Page 1068: Our Coffee It has always been, and
- Page 1072: EXHIBIT 3 Starbucks’ Balance Shee
- Page 1076: EXHIBIT 4 Segment Financial Data Se
- Page 1080: Conclusion Starbucks continues to b
- Page 1084: EXHIBIT 1 USPS Summary Financial Da
- Page 1088:
EXHIBIT 2 USPS Operating Expenses (
- Page 1092:
CASE 14 • THE UNITED STATES POSTA
- Page 1096:
EXHIBIT 10 USPS Vehicle Inventory (
- Page 1100:
EXHIBIT 13 USPS Operating Statistic
- Page 1104:
EXHIBIT 13 USPS Operating Statistic
- Page 1108:
EXHIBIT 1 Amtrak Route Map SEATTLE
- Page 1112:
CASE 15 • NATIONAL RAILROAD PASSE
- Page 1116:
CASE 15 • NATIONAL RAILROAD PASSE
- Page 1120:
CASE 15 • NATIONAL RAILROAD PASSE
- Page 1124:
CASE 16 • GOODWILL OF SAN FRANCIS
- Page 1128:
CASE 16 • GOODWILL OF SAN FRANCIS
- Page 1132:
CASE 16 • GOODWILL OF SAN FRANCIS
- Page 1136:
EXHIBIT 6 Goodwill Revenue Growth R
- Page 1140:
wooden shed with the words “Harle
- Page 1144:
notes, due in 2014. The money will
- Page 1148:
84 percent, 80 percent, and 79 perc
- Page 1152:
EXHIBIT 4 Income Statements (2006-2
- Page 1156:
net income were down 2.3 percent an
- Page 1160:
EXHIBIT 1 Ford Motor Company Corpor
- Page 1164:
Motorcraft Ford purchased Electric
- Page 1168:
carrying over $1 billion in goodwil
- Page 1172:
In late 2009, Ford added shifts at
- Page 1176:
the largest food company in the Uni
- Page 1180:
way of creating some interactivity
- Page 1184:
At year-end 2009, the company had s
- Page 1188:
Prior to 2006, ConAgra was a holdin
- Page 1192:
process, and Hershey extensively re
- Page 1196:
EXHIBIT 2 The Hershey Company Conso
- Page 1200:
acquisitions and joint ventures wit
- Page 1204:
Cadbury Cadbury, formerly known as
- Page 1208:
21 Johnson & Johnson — 2009 Shary
- Page 1212:
EXHIBIT 2 J&J’s Mission Statement
- Page 1216:
EXHIBIT 4 J&J Facilities Pharmaceut
- Page 1220:
EXHIBIT 5 Large Competitors to J&J
- Page 1224:
Even the largest pharmaceutical com
- Page 1228:
EXHIBIT 8 J&J Balance Sheets 2006-2
- Page 1232:
James Preston, the CEO of Avon, fou
- Page 1236:
In their new promotions, the Avon l
- Page 1240:
EXHIBIT 5 Avon’s Balance Sheets (
- Page 1244:
EXHIBIT 7 Avon’s Executive Team A
- Page 1248:
ut he also proved he knew how to ma
- Page 1252:
Internal Factors Business Structure
- Page 1256:
EXHIBIT 3 Molson Coors Consolidated
- Page 1260:
The market for the target customer
- Page 1264:
Another factor has been the current
- Page 1268:
cost about $14 a case, or $5 less t
- Page 1272:
Bradham followed the example of Coc
- Page 1276:
EXHIBIT 2 PepsiCo 2008 Income State
- Page 1280:
EXHIBIT 6 World Demand for the Nona
- Page 1284:
EXHIBIT 7 World Chip Market In mill
- Page 1288:
Coca-Cola will continue to concentr
- Page 1292:
25 Pfizer, Inc. — 2009 Vijaya Nar
- Page 1296:
EXHIBIT 1 Revenues by Key Products
- Page 1300:
Pfizer’s consolidated Balance She
- Page 1304:
EXHIBIT 7 Overview of Direct Compet
- Page 1308:
number should reach $265 billion in
- Page 1312:
EXHIBIT 1 Merck’s Recent Acquisit
- Page 1316:
EXHIBIT 3 Merck’s Sales by Produc
- Page 1320:
Industry Issues, Facts, and Figures
- Page 1324:
prescriptions. Because the price of
- Page 1328:
27 Nike, Inc. — 2010 1 Randy Harr
- Page 1332:
The company has set a strategic goa
- Page 1336:
EXHIBIT 5 Nike’s Income Before Ta
- Page 1340:
Nike Customers and Price Points Bec
- Page 1344:
Competition Competition in the athl
- Page 1348:
eliminate quotas and tariff barrier
- Page 1352:
The company acquired FrogTrader to
- Page 1356:
CASE 28 • CALLAWAY GOLF COMPANY
- Page 1360:
Pacific PTY Ltd., Callaway Golf (Sh
- Page 1364:
3.5 percent for the first quarter o
- Page 1368:
public and private golf clubs are e
- Page 1372:
Standard Oil and created Standard o
- Page 1376:
EXHIBIT 3 Statement of Income (mill
- Page 1380:
Marketing Marketing in an energy co
- Page 1384:
company in the world in 2007. The 2