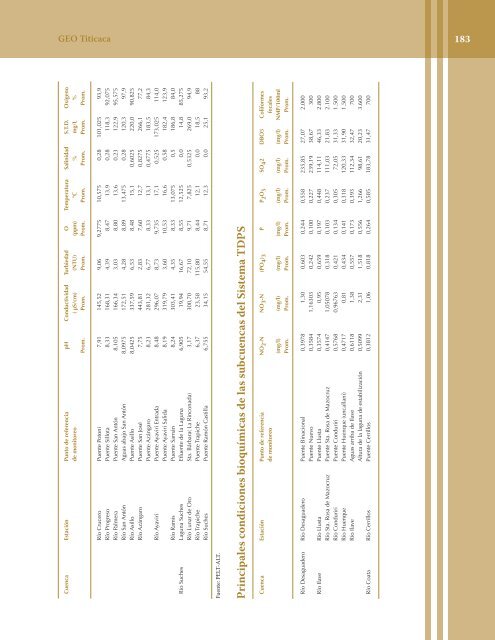
182 Anexos ANEXO 2 Principales condiciones fisicoquímicas <strong>de</strong> las subcuencas <strong>de</strong>l Sistema <strong>TDPS</strong> Cuenca Estación Punto <strong>de</strong> referencia pH Conductividad Turbiedad O Temperatura Salinidad S.T.D. Oxígeno <strong>de</strong> monitoreo ( μS/cm) (NTU) (ppm) °C % mg/L % Prom. Prom. Prom. Prom. Prom. Prom. Prom. Prom. Río Desagua<strong>de</strong>ro Río Desagua<strong>de</strong>ro Puente Binacional 8,55 685,95 5,58 9,88 16,5 1,27 555,3 113 Puente Nuevo 8,91 660,69 2,08 8,17 15,7 1,20 545,5 98,6 Río Ilave Río Llusta Puente Llusta 8,305 163,10 3,01 8,6075 16,2 0,23 112,975 103,9 Río Sta. Rosa <strong>de</strong> Mazocruz Puente Sta. Rosa <strong>de</strong> Mazocruz 8,07 65,39 3,60 8,05 17,7 0,05 42,1 98,8 Río Conduriri Puente Conduriri 8,33 52,79 2,08 7,6 17,5 0 35,4 93,175 Río Huenque Puente Huenque (Uncallani) 8,3925 245,62 1,84 8,28 15,3 0,40 165,7 95,975 Río Ilave Aguas arriba <strong>de</strong> Ilave 7,84 224,83 5,45 8,66 12,6 0,35 145,475 89,8 Altura <strong>de</strong> la laguna <strong>de</strong> Estabilización 7,975 255,50 12,85 9,495 14,8 0,40 160,5 104,55 Río Coata Río Cerrillos Puente Cerrillos 8,7875 339,20 1,81 9,88 14,0 0,53 205,75 108,3 Río Paratía Entrada MINSUR 7,69 56,95 1,60 8,2925 11,375 0,22 14,4 86,175 Salida MINSUR 7,4975 94,68 11,26 9,62 14,9 0,08 52 110,2 Río Ver<strong>de</strong> Puente Choroma 6,66 599,53 5,42 9,31 11,6 1,1 350,5 96,7 Río Cabanillas Aguas <strong>de</strong>bajo <strong>de</strong> Cabanillas 7,60 418,33 31,17 9,15 11,85 0,8025 320,0 92,9 Río Lampa Puente Lampa 8,025 125,66 14,38 9,54 16,8 0,15 73,6 110,7 Río Coata Puente Unocolla 8,23 396,76 12,14 10,72 15,6 0,7 205,4 122,9 Aguas arriba <strong>de</strong> Coata 7,78 490,56 15,56 8,34 12,0 0,90 282,0 81,975 Río Huancané Río Putina Puente Ichoccollo (Quilca) 8,15 222,68 3,46 8,7625 15,95 0,25 146,5 92,0 Puente Putina 8,285 377,94 5,54 10,50 16,7 0,65 229,8 105,175 Río Huancané Puente Muñani 8,2225 256,35 10,65 8,14 15,3 0,4525 174,375 86,9 Puente Huancané 8,19 607,33 5,08 9,57 14,7 1,0775 349,8 102,5 Río Ramis Río Ocuviri Puente Ocuviri 7,17 257,00 9,06 7,3275 12,6 0,4 161,4 80,5 Río Llalli Puente Llallimayo 8,1 290,47 3,29 8,65 16,7 0,5025 222,275 102,775 Río Santa Rosa Puente Santa Rosa M<strong>el</strong>gar 7,6725 587,33 7,61 9,21 16,85 1,08 342,3 108,3 Río Umachiri Puente Umachiri 8,35 224,24 2,95 9,86 17,5 0,35 136,9 122,925 Río Antauta Aguas Abajo Mina San Rafa<strong>el</strong> 6,93 248,52 9,02 8,05 14 0,4525 167,7 85,1 Río Ananea Laguna Pampa Blanca 6,25 34,37 456,60 8,02 8,9 0,0 17,1 79,0 Río Ananea 6,4325 127,76 323,40 8,21 12,45 0,20 84,5 83,825
GEO Titicaca 183 Cuenca Estación Punto <strong>de</strong> referencia pH Conductividad Turbiedad O Temperatura Salinidad S.T.D. Oxígeno <strong>de</strong> monitoreo ( μS/cm) (NTU) (ppm) °C % mg/L % Prom. Prom. Prom. Prom. Prom. Prom. Prom. Prom. Río Crucero Puente Potoni 7,91 145,52 9,06 9,2775 10,575 0,28 101,025 93,9 Río Progreso Puente Sillota 8,33 168,31 4,39 8,47 13,9 0,28 118,3 92,075 Río Palmera Puente San Antón 8,105 166,34 3,03 8,80 13,6 0,23 122,9 95,575 Río San Antón Aguas abajo San Antón 8,0975 172,51 4,28 8,89 13,475 0,28 120,3 97,9 Río Asillo Puente Asillo 8,0425 337,59 6,53 8,48 15,1 0,6025 220,0 90,825 Río Azángaro Puente San José 7,75 443,81 2,83 7,60 12,7 0,8275 266,1 77,2 Puente Azángaro 8,23 281,32 6,77 8,33 13,1 0,4775 183,5 84,3 Río Ayaviri Puente Ayaviri Entrada 8,48 296,07 8,73 9,735 17,1 0,525 173,025 114,0 Puente Ayaviri Salida 8,19 319,79 3,60 10,53 16,6 0,58 182,4 123,9 Río Ramis Puente Samán 8,24 303,41 4,35 8,33 13,075 0,5 186,8 84,0 Río Suches Laguna Suches Efluente <strong>de</strong> la Laguna 6,905 19,94 16,67 8,55 12,525 0,0 14,8 85,275 Río Lunar <strong>de</strong> Oro Sta. Bárbara( La Rinconada) 3,17 300,70 72,10 9,71 7,825 0,5325 269,0 94,9 Río Trapiche Puente Trapiche 6,37 23,58 115,80 8,44 12,1 0,0 18,5 88 Río Suches Puente Ramón Castilla 6,755 34,15 54,55 8,71 12,3 0,0 25,1 93,2 Fuente: PELT-ALT. Principales condiciones bioquímicas <strong>de</strong> las subcuencas <strong>de</strong>l Sistema <strong>TDPS</strong> Cuenca Estación Punto <strong>de</strong> referencia NO 2 -N NO 3 -N (PO 4 ) 3 P P 2 O 5 SO 4 2 DBO5 Coliformes <strong>de</strong> monitoreo fecales (mg/l) (mg/l) (mg/l) (mg/l) (mg/l) (mg/l) (mg/l) NMP/100ml Prom. Prom. Prom. Prom. Prom. Prom. Prom. Prom. Río Desagua<strong>de</strong>ro Río Desagua<strong>de</strong>ro Puente Binacional 0,3978 1,30 0,603 0,244 0,558 235,85 27,07 2.000 Puente Nuevo 0,3584 1,16303 0,242 0,100 0,227 239,19 38,67 300 Río Ilave Río Llusta Puente Llusta 0,3574 0,95 0,659 0,197 0,448 114,11 46,33 2.800 Río Sta. Rosa <strong>de</strong> Mazocruz Puente Sta. Rosa <strong>de</strong> Mazocruz 0,4147 1,05078 0,318 0,103 0,237 111,03 21,83 2.100 Río Conduriri Puente Conduriri 0,5768 0,96763 0,421 0,134 0,305 72,05 31,33 1.500 Río Huenque Puente Huenque (uncallani) 0,4717 0,81 0,434 0,141 0,318 120,33 31,90 1.500 Río Ilave Aguas arriba <strong>de</strong> Ilave 0,6118 1,38 0,557 0,173 0,393 112,34 32,47 700 Altura <strong>de</strong> la laguna <strong>de</strong> estabilización 0,5099 2,31 1,518 0,556 1,266 98,61 20,23 3.600 Río Coata Río Cerrillos Puente Cerrillos 0,3812 1,06 0,818 0,264 0,585 183,78 31,47 700
- Page 1 and 2:
Perspectivas del Medio Ambiente en
- Page 3:
Perspectivas del Medio Ambiente en
- Page 6 and 7:
Participantes del Taller de Orienta
- Page 8 and 9:
La escasez, dispersión y falta de
- Page 10 and 11:
2.2.5 Especies amenazadas de fauna
- Page 12 and 13:
Índice de cuadros Capítulo 1 Cuad
- Page 14 and 15:
Capítulo 3 Figura 3.1 Totoral en e
- Page 16 and 17:
14 Guía del lector Capítulo III.
- Page 18 and 19:
16 Mensajes clave El Sistema TDPS f
- Page 20:
Contexto geográfico, histórico, d
- Page 23 and 24:
GEO Titicaca 21 En este contexto f
- Page 25 and 26:
GEO Titicaca 23 Se distinguen las s
- Page 27 and 28:
GEO Titicaca 25 1.3 Característica
- Page 29 and 30:
GEO Titicaca 27 Figura 1.5. Mapa cl
- Page 31 and 32:
GEO Titicaca 29 Figura 1.6. Mapa de
- Page 33 and 34:
GEO Titicaca 31 desaparición, su a
- Page 35 and 36:
GEO Titicaca 33 1.5 Aspectos demogr
- Page 37 and 38:
GEO Titicaca 35 En cuanto a la tasa
- Page 39 and 40:
GEO Titicaca 37 tivamente). En este
- Page 41 and 42:
GEO Titicaca 39 1.5.7.1 Sector agro
- Page 43 and 44:
GEO Titicaca 41 1.6 Evolución de r
- Page 45 and 46:
GEO Titicaca 43 En la región andin
- Page 48 and 49:
46 Estado del medio ambiente 2.1 Oc
- Page 50 and 51:
48 Estado del medio ambiente 2.1.2
- Page 52 and 53:
50 Estado del medio ambiente Cuadro
- Page 54 and 55:
52 Estado del medio ambiente Figura
- Page 56 and 57:
54 Estado del medio ambiente Ecosis
- Page 58 and 59:
56 Estado del medio ambiente Figura
- Page 60 and 61:
58 Estado del medio ambiente de ext
- Page 62 and 63:
60 Estado del medio ambiente 2.2.4.
- Page 64 and 65:
62 Estado del medio ambiente De acu
- Page 66 and 67:
64 Estado del medio ambiente Un est
- Page 68 and 69:
66 Estado del medio ambiente 2.2.8
- Page 70 and 71:
68 Estado del medio ambiente 2.3 Ec
- Page 72 and 73:
70 Estado del medio ambiente El lag
- Page 74 and 75:
72 Estado del medio ambiente Inunda
- Page 76 and 77:
74 Estado del medio ambiente Figura
- Page 78 and 79:
76 Estado del medio ambiente Cuadro
- Page 80 and 81:
78 Estado del medio ambiente Figura
- Page 82 and 83:
80 Estado del medio ambiente Egstro
- Page 84 and 85:
82 Estado del medio ambiente (1996)
- Page 86 and 87:
84 Estado del medio ambiente Cuadro
- Page 88 and 89:
86 Estado del medio ambiente Cuadro
- Page 90 and 91:
88 Estado del medio ambiente degrad
- Page 92 and 93:
90 Estado del medio ambiente Cuadro
- Page 94 and 95:
92 Estado del medio ambiente Figura
- Page 96 and 97:
94 Estado del medio ambiente Cuadro
- Page 98:
Impactos
- Page 101 and 102:
GEO Titicaca 99 Cuadro 3.1. Capacid
- Page 103 and 104:
GEO Titicaca 101 Foto: Albatros Med
- Page 105 and 106:
GEO Titicaca 103 Titicaca Alto Maur
- Page 107 and 108:
GEO Titicaca 105 equivalente a una
- Page 109 and 110:
GEO Titicaca 107 La generación de
- Page 111 and 112:
GEO Titicaca 109 otras macrófitas
- Page 113 and 114:
GEO Titicaca 111 (0,4 ppm de Hg). A
- Page 115 and 116:
GEO Titicaca 113 La contaminación
- Page 117 and 118:
GEO Titicaca 115 Interagencial sobr
- Page 119 and 120:
GEO Titicaca 117 Cuadro 3.7. Comuni
- Page 121 and 122:
GEO Titicaca 119 tes no asalariados
- Page 123 and 124:
GEO Titicaca 121 Cuadro 3.12. Regis
- Page 126 and 127:
124 Instrumentos de gestión 4.1 Go
- Page 128 and 129:
126 Instrumentos de gestión Bolivi
- Page 130 and 131:
128 Instrumentos de gestión Patrim
- Page 132 and 133:
130 Instrumentos de gestión ambien
- Page 134 and 135: 132 Instrumentos de gestión Ambien
- Page 136 and 137: 134 Instrumentos de gestión consid
- Page 138 and 139: 136 Instrumentos de gestión instit
- Page 140 and 141: 138 Instrumentos de gestión 4.3.5
- Page 142: Opciones para la acción y perspect
- Page 145 and 146: GEO Titicaca 143 5.1 Introducción
- Page 147 and 148: GEO Titicaca 145 procesos de adecua
- Page 149 and 150: GEO Titicaca 147 5.2.2 El turismo y
- Page 151 and 152: GEO Titicaca 149 gación sobre el e
- Page 153 and 154: GEO Titicaca 151 Estas positivas ex
- Page 155 and 156: GEO Titicaca 153 Frente a esta situ
- Page 157 and 158: GEO Titicaca 155 de tratamiento de
- Page 159 and 160: GEO Titicaca 157 Reconociendo que l
- Page 161: GEO Titicaca 159 • Desarrollar un
- Page 165 and 166: GEO Titicaca 163 Colque, G. et al.
- Page 167 and 168: GEO Titicaca 165 Marconi, M. 1992.
- Page 169: GEO Titicaca 167 lagos Poopó y Uru
- Page 173 and 174: GEO Titicaca 171 DGOT DIGESA DIREPE
- Page 175: GEO Titicaca 173 PNACC PNUD PNUMA P
- Page 179 and 180: GEO Titicaca 177 Provincia Municipi
- Page 181 and 182: GEO Titicaca 179 Provincia Distrito
- Page 183: GEO Titicaca 181 CHILE XV a REGIÓN
- Page 187: Programa de las Naciones Unidas par