rivista italiana di economia demografia e statistica - Sieds
rivista italiana di economia demografia e statistica - Sieds
rivista italiana di economia demografia e statistica - Sieds

Create successful ePaper yourself
Turn your PDF publications into a flip-book with our unique Google optimized e-Paper software.
10<br />
Volume LXV n. 1 – Gennaio-Marzo 2011<br />
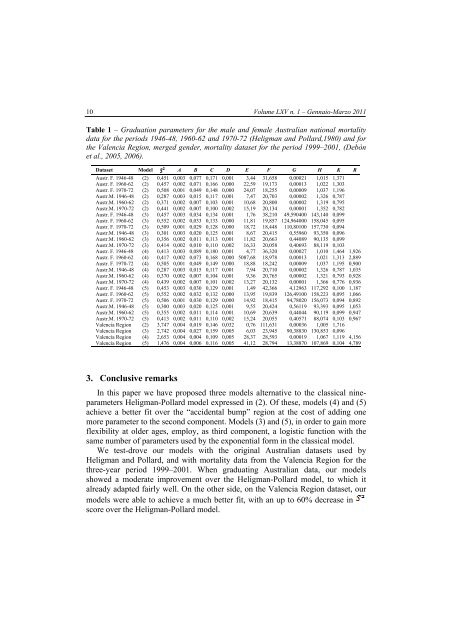
Table 1 – Graduation parameters for the male and female Australian national mortality<br />
data for the periods 1946-48, 1960-62 and 1970-72 (Heligman and Pollard,1980) and for<br />
the Valencia Region, merged gender, mortality dataset for the period 1999–2001, (Debòn<br />
et al., 2005, 2006).<br />
Dataset Model A B C D E F G H K R<br />
Austr. F. 1946-48 (2) 0,451 0,003 0,077 0,171 0,001 3,44 31,658 0,00021 1,015 1,371<br />
Austr. F. 1960-62 (2) 0,457 0,002 0,071 0,166 0,000 22,59 19,173 0,00013 1,022 1,303<br />
Austr. F. 1970-72 (2) 0,508 0,001 0,049 0,148 0,000 24,07 18,255 0,00009 1,037 1,196<br />
Austr.M. 1946-48 (2) 0,287 0,003 0,015 0,117 0,001 7,47 20,703 0,00002 1,326 0,787<br />
Austr.M. 1960-62 (2) 0,371 0,002 0,007 0,103 0,001 10,68 20,800 0,00002 1,319 0,795<br />
Austr.M. 1970-72 (2) 0,441 0,002 0,007 0,100 0,002 15,19 20,134 0,00001 1,352 0,782<br />
Austr. F. 1946-48 (3) 0,457 0,003 0,034 0,134 0,001 1,76 38,210 49,590400 143,140 0,099<br />
Austr. F. 1960-62 (3) 0,552 0,002 0,033 0,133 0,000 11,81 19,857 124,964000 158,045 0,095<br />
Austr. F. 1970-72 (3) 0,509 0,001 0,029 0,128 0,000 18,72 18,448 110,80100 157,730 0,094<br />
Austr.M. 1946-48 (3) 0,301 0,003 0,020 0,125 0,001 8,67 20,415 0,55960 93,350 0,096<br />
Austr.M. 1960-62 (3) 0,356 0,002 0,011 0,113 0,001 11,82 20,663 0,44089 90,135 0,099<br />
Austr.M. 1970-72 (3) 0,414 0,002 0,010 0,110 0,002 16,33 20,058 0,40693 88,119 0,103<br />
Austr. F. 1946-48 (4) 0,413 0,003 0,089 0,180 0,001 4,77 36,320 0,00027 1,010 1,464 1,926<br />
Austr. F. 1960-62 (4) 0,417 0,002 0,073 0,168 0,000 5087,68 18,978 0,00013 1,021 1,313 2,889<br />
Austr. F. 1970-72 (4) 0,505 0,001 0,049 0,149 0,000 18,88 18,242 0,00009 1,037 1,195 0,900<br />
Austr.M. 1946-48 (4) 0,287 0,003 0,015 0,117 0,001 7,94 20,710 0,00002 1,326 0,787 1,035<br />
Austr.M. 1960-62 (4) 0,370 0,002 0,007 0,104 0,001 9,36 20,765 0,00002 1,321 0,793 0,928<br />
Austr.M. 1970-72 (4) 0,439 0,002 0,007 0,101 0,002 13,27 20,132 0,00001 1,366 0,776 0,936<br />
Austr. F. 1946-48 (5) 0,453 0,003 0,030 0,129 0,001 1,49 42,366 4,12963 117,292 0,100 1,187<br />
Austr. F. 1960-62 (5) 0,552 0,002 0,032 0,132 0,000 13,95 19,839 126,49100 158,223 0,095 1,066<br />
Austr. F. 1970-72 (5) 0,506 0,001 0,030 0,129 0,000 14,92 18,415 94,78020 156,073 0,094 0,892<br />
Austr.M. 1946-48 (5) 0,300 0,003 0,020 0,125 0,001 9,55 20,424 0,56119 93,393 0,095 1,053<br />
Austr.M. 1960-62 (5) 0,355 0,002 0,011 0,114 0,001 10,69 20,639 0,44044 90,119 0,099 0,947<br />
Austr.M. 1970-72 (5) 0,413 0,002 0,011 0,110 0,002 15,24 20,055 0,40571 88,074 0,103 0,967<br />
Valencia Region (2) 3,747 0,004 0,019 0,146 0,032 0,76 111,631 0,00036 1,005 1,716<br />
Valencia Region (3) 2,742 0,004 0,027 0,159 0,005 6,03 23,945 90,38830 130,853 0,096<br />
Valencia Region (4) 2,653 0,004 0,004 0,109 0,005 28,37 28,593 0,00019 1,067 1,119 4,156<br />
Valencia Region (5) 1,476 0,004 0,006 0,116 0,005 41,12 28,794 13,38870 107,869 0,104 4,789<br />
3. Conclusive remarks<br />
In this paper we have proposed three models alternative to the classical nineparameters<br />
Heligman-Pollard model expressed in (2). Of these, models (4) and (5)<br />
achieve a better fit over the “accidental bump” region at the cost of ad<strong>di</strong>ng one<br />
more parameter to the second component. Models (3) and (5), in order to gain more<br />
flexibility at older ages, employ, as third component, a logistic function with the<br />
same number of parameters used by the exponential form in the classical model.<br />
We test-drove our models with the original Australian datasets used by<br />
Heligman and Pollard, and with mortality data from the Valencia Region for the<br />
three-year period 1999–2001. When graduating Australian data, our models<br />
showed a moderate improvement over the Heligman-Pollard model, to which it<br />
already adapted fairly well. On the other side, on the Valencia Region dataset, our<br />
models were able to achieve a much better fit, with an up to 60% decrease in<br />
score over the Heligman-Pollard model.