Fourierreihen und Fouriertransformation - Fachhochschule ...
Fourierreihen und Fouriertransformation - Fachhochschule ...
Fourierreihen und Fouriertransformation - Fachhochschule ...

Erfolgreiche ePaper selbst erstellen
Machen Sie aus Ihren PDF Publikationen ein blätterbares Flipbook mit unserer einzigartigen Google optimierten e-Paper Software.
<strong>Fourierreihen</strong> <strong>und</strong> <strong>Fouriertransformation</strong> 94<br />
Examples<br />
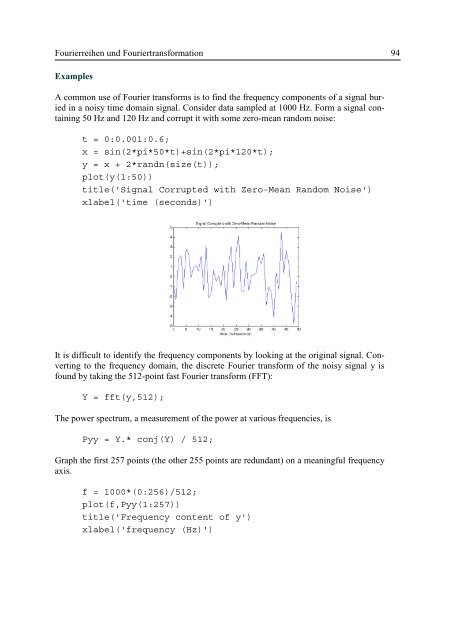
A common use of Fourier transforms is to find the frequency components of a signal buried<br />
in a noisy time domain signal. Consider data sampled at 1000 Hz. Form a signal containing<br />
50 Hz and 120 Hz and corrupt it with some zero-mean random noise:<br />
t = 0:0.001:0.6;<br />
x = sin(2*pi*50*t)+sin(2*pi*120*t);<br />
y = x + 2*randn(size(t));<br />
plot(y(1:50))<br />
title('Signal Corrupted with Zero-Mean Random Noise')<br />
xlabel('time (seconds)')<br />
It is difficult to identify the frequency components by looking at the original signal. Converting<br />
to the frequency domain, the discrete Fourier transform of the noisy signal y is<br />
fo<strong>und</strong> by taking the 512-point fast Fourier transform (FFT):<br />
Y = fft(y,512);<br />
The power spectrum, a measurement of the power at various frequencies, is<br />
Pyy = Y.* conj(Y) / 512;<br />
Graph the first 257 points (the other 255 points are red<strong>und</strong>ant) on a meaningful frequency<br />
axis.<br />
f = 1000*(0:256)/512;<br />
plot(f,Pyy(1:257))<br />
title('Frequency content of y')<br />
xlabel('frequency (Hz)')