Fourierreihen und Fouriertransformation - Fachhochschule ...
Fourierreihen und Fouriertransformation - Fachhochschule ...
Fourierreihen und Fouriertransformation - Fachhochschule ...

Sie wollen auch ein ePaper? Erhöhen Sie die Reichweite Ihrer Titel.
YUMPU macht aus Druck-PDFs automatisch weboptimierte ePaper, die Google liebt.
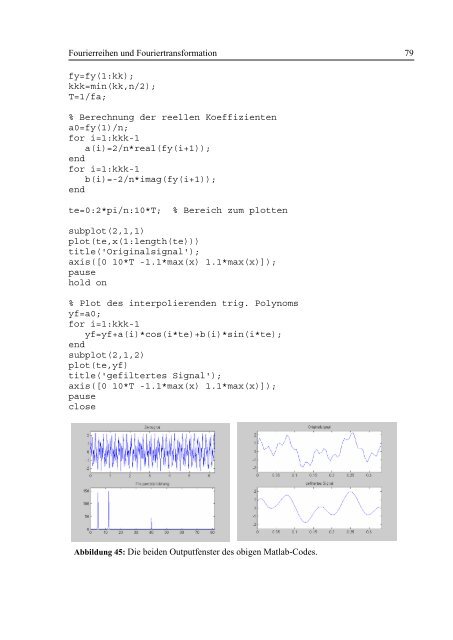
<strong>Fourierreihen</strong> <strong>und</strong> <strong>Fouriertransformation</strong> 79<br />
fy=fy(1:kk);<br />
kkk=min(kk,n/2);<br />
T=1/fa;<br />
% Berechnung der reellen Koeffizienten<br />
a0=fy(1)/n;<br />
for i=1:kkk-1<br />
a(i)=2/n*real(fy(i+1));<br />
end<br />
for i=1:kkk-1<br />
b(i)=-2/n*imag(fy(i+1));<br />
end<br />
te=0:2*pi/n:10*T; % Bereich zum plotten<br />
subplot(2,1,1)<br />
plot(te,x(1:length(te)))<br />
title('Originalsignal');<br />
axis([0 10*T -1.1*max(x) 1.1*max(x)]);<br />
pause<br />
hold on<br />
% Plot des interpolierenden trig. Polynoms<br />
yf=a0;<br />
for i=1:kkk-1<br />
yf=yf+a(i)*cos(i*te)+b(i)*sin(i*te);<br />
end<br />
subplot(2,1,2)<br />
plot(te,yf)<br />
title('gefiltertes Signal');<br />
axis([0 10*T -1.1*max(x) 1.1*max(x)]);<br />
pause<br />
close<br />
Abbildung 45: Die beiden Outputfenster des obigen Matlab-Codes.