Fourierreihen und Fouriertransformation - Fachhochschule ...
Fourierreihen und Fouriertransformation - Fachhochschule ...
Fourierreihen und Fouriertransformation - Fachhochschule ...

Erfolgreiche ePaper selbst erstellen
Machen Sie aus Ihren PDF Publikationen ein blätterbares Flipbook mit unserer einzigartigen Google optimierten e-Paper Software.
<strong>Fourierreihen</strong> <strong>und</strong> <strong>Fouriertransformation</strong> 62<br />
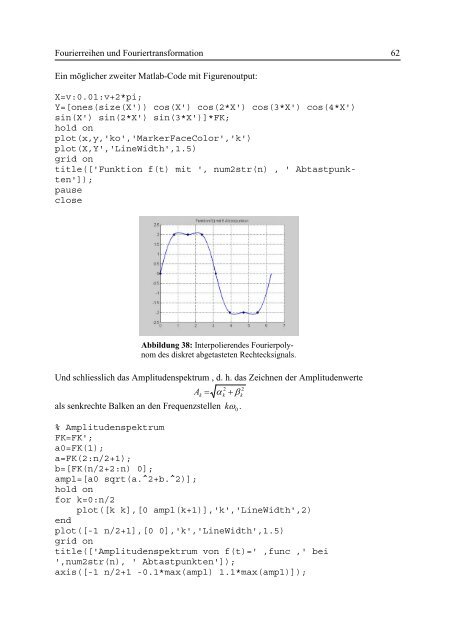
Ein möglicher zweiter Matlab-Code mit Figurenoutput:<br />
X=v:0.01:v+2*pi;<br />
Y=[ones(size(X')) cos(X') cos(2*X') cos(3*X') cos(4*X')<br />
sin(X') sin(2*X') sin(3*X')]*FK;<br />
hold on<br />
plot(x,y,'ko','MarkerFaceColor','k')<br />
plot(X,Y','LineWidth',1.5)<br />
grid on<br />
title(['Funktion f(t) mit ', num2str(n) , ' Abtastpunkten']);<br />
pause<br />
close<br />
Abbildung 38: Interpolierendes Fourierpolynom<br />
des diskret abgetasteten Rechtecksignals.<br />
Und schliesslich das Amplitudenspektrum , d. h. das Zeichnen der Amplitudenwerte<br />
2 2<br />
= α + β<br />
als senkrechte Balken an den Frequenzstellen k ω0<br />
.<br />
% Amplitudenspektrum<br />
FK=FK';<br />
a0=FK(1);<br />
a=FK(2:n/2+1);<br />
b=[FK(n/2+2:n) 0];<br />
ampl=[a0 sqrt(a.^2+b.^2)];<br />
hold on<br />
for k=0:n/2<br />
plot([k k],[0 ampl(k+1)],'k','LineWidth',2)<br />
end<br />
plot([-1 n/2+1],[0 0],'k','LineWidth',1.5)<br />
grid on<br />
title(['Amplitudenspektrum von f(t)=' ,func ,' bei<br />
',num2str(n), ' Abtastpunkten']);<br />
axis([-1 n/2+1 -0.1*max(ampl) 1.1*max(ampl)]);<br />
Ak<br />
k<br />
k