Fourierreihen und Fouriertransformation - Fachhochschule ...
Fourierreihen und Fouriertransformation - Fachhochschule ...
Fourierreihen und Fouriertransformation - Fachhochschule ...

Erfolgreiche ePaper selbst erstellen
Machen Sie aus Ihren PDF Publikationen ein blätterbares Flipbook mit unserer einzigartigen Google optimierten e-Paper Software.
<strong>Fourierreihen</strong> <strong>und</strong> <strong>Fouriertransformation</strong> 72<br />
end<br />
a(n/2)=real(fy(n/2+1))/n;<br />
an=a'<br />
% Bezeichnungen Literatur Index mit 0 beginnend<br />
for i=1:n/2-1<br />
b(i)=-2/n*imag(fy(i+1));<br />
end<br />
bn=b'<br />
% Plot des interpolierten Signals<br />
% t-Intervall ist [0,2N]=[0,n]<br />
% Abtastzeitpunkte tk=k/(2N) , k = 0,..., 2N-1<br />
t=-1:0.05:n+1; % Bereich zum plotten<br />
yf=a0;<br />
for i=1:n/2-1<br />
yf=yf+a(i)*cos(i*2*pi/n*t)+b(i)*sin(i*2*pi/n*t);<br />
end<br />
yf=yf+a(n/2)*cos(pi*t);<br />
plot(t,yf,'LineWidth',1.5);<br />
pause<br />
% Falls Periode der Abtastzeitpunkte = 2*pi<br />
% t- Intervall ist [0,2pi]<br />
% Abtastzeitpunkte tk=k*pi/N , k = 0,..., 2N-1<br />
t=[0:7]*2*pi/n;<br />
subplot(3,1,2)<br />
plot(t,y,'o','MarkerFaceColor','k');<br />
title(['Periode = 2pi']);<br />
axis([-pi/2 5/2*pi min(y)-1 max(y)+1])<br />
grid on<br />
% Plot des interpolierten Signals<br />
t=-1:0.05:2*pi+1; % Bereich zum plotten<br />
yf=a0;<br />
for i=1:n/2-1<br />
yf=yf+a(i)*cos(i*t)+b(i)*sin(i*t);<br />
end<br />
yf=yf+a(n/2)*cos(n/2*t);<br />
hold on<br />
plot(t,yf,'LineWidth',1.5);<br />
pause<br />
close<br />
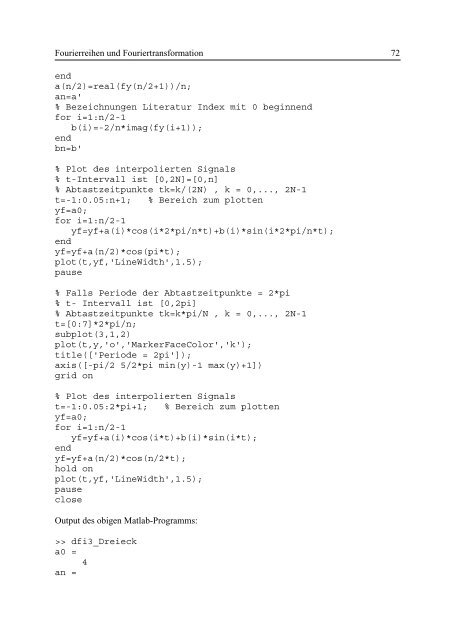
Output des obigen Matlab-Programms:<br />
>> dfi3_Dreieck<br />
a0 =<br />
4<br />
an =