Trust Board Febuary 2010 - Sandwell & West Birmingham Hospitals
Trust Board Febuary 2010 - Sandwell & West Birmingham Hospitals
Trust Board Febuary 2010 - Sandwell & West Birmingham Hospitals

You also want an ePaper? Increase the reach of your titles
YUMPU automatically turns print PDFs into web optimized ePapers that Google loves.
SWBTB (2/10) 045 (b)<br />
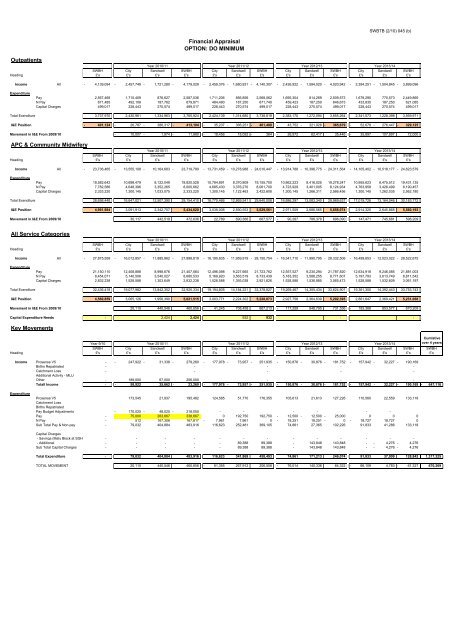
Outpatients<br />
Financial Appraisal<br />
OPTION: DO MINIMUM<br />
Year <strong>2010</strong>/11 Year 2011/12 Year 2012/13 Year 2013/14<br />
SWBH City <strong>Sandwell</strong> SWBH City <strong>Sandwell</strong> SWBH City <strong>Sandwell</strong> SWBH City <strong>Sandwell</strong> SWBH<br />
Heading £'s £'s £'s £'s £'s £'s £'s £'s £'s £'s £'s £'s £'s<br />
Income All - 4,139,094 - 2,457,749 - 1,721,280 - 4,179,029 - 2,459,376 - 1,680,931 - 4,140,307 - 2,426,922 - 1,594,020 - 4,020,942 - 2,394,251 - 1,504,845 - 3,899,096<br />
Expenditure<br />
Pay 2,567,468 1,710,409 876,627 2,587,036 1,711,206 856,856 2,568,062 1,695,304 814,269 2,509,573 1,679,295 770,573 2,449,869<br />
N Pay 671,485 492,109 187,762 679,871 484,490 187,250 671,740 459,423 187,250 646,673 433,835 187,250 621,085<br />
Capital Charges 499,017 228,443 270,574 499,017 228,443 270,574 499,017 228,443 270,574 499,017 228,443 270,574 499,017<br />
Total Exenditure 3,737,970 2,430,961 1,334,963 3,765,924 2,424,139 1,314,680 3,738,819 2,383,170 1,272,094 3,655,264 2,341,573 1,228,398 3,569,971<br />
I&E Position - 401,124 - 26,787 - 386,317 - 413,104 - 35,237 - 366,251 - 401,488 - 43,752 - 321,926 - 365,679 - 52,678 - 276,447 - 329,125<br />
Movement in I&E From 2009/10 - 10,007 - 1,974 - 11,980 - 18,456 18,092 - 364 - 26,972 62,417 35,446 - 35,897 107,897 72,000<br />
APC & Community Midwifery<br />
Year <strong>2010</strong>/11 Year 2011/12 Year 2012/13 Year 2013/14<br />
SWBH City <strong>Sandwell</strong> SWBH City <strong>Sandwell</strong> SWBH City <strong>Sandwell</strong> SWBH City <strong>Sandwell</strong> SWBH<br />
Heading £'s £'s £'s £'s £'s £'s £'s £'s £'s £'s £'s £'s £'s<br />
Income All - 23,736,465 - 13,555,108 - 10,164,683 - 23,719,790 - 13,731,459 - 10,278,988 - 24,010,447 - 13,914,788 - 10,396,775 - 24,311,564 - 14,105,402 - 10,518,177 - 24,623,579<br />
Expenditure<br />
Pay 18,582,642 10,698,479 8,122,049 18,820,528 10,784,891 8,370,809 19,155,700 10,862,223 8,416,025 19,278,247 10,955,623 8,475,512 19,431,135<br />
N Pay 7,782,586 4,648,396 3,352,265 8,000,662 4,685,430 3,376,270 8,061,700 4,723,929 3,401,005 8,124,934 4,763,958 3,426,499 8,190,457<br />
Capital Charges 2,333,220 1,300,145 1,033,075 2,333,220 1,300,145 1,122,463 2,422,608 1,300,145 1,266,311 2,566,456 1,300,145 1,262,035 2,562,180<br />
Total Exenditure 28,698,448 16,647,021 12,507,390 29,154,410 16,770,466 12,869,541 29,640,008 16,886,297 13,083,340 29,969,637 17,019,726 13,164,046 30,183,772<br />
I&E Position 4,961,984 3,091,913 2,342,707 5,434,620 3,039,008 2,590,553 5,629,561 2,971,509 2,686,565 5,658,074 2,914,325 2,645,868 5,560,193<br />
Movement in I&E From 2009/10 30,117 442,519 472,636 - 22,789 690,366 667,577 - 90,287 786,378 696,090 - 147,471 745,681 598,209<br />
All Service Categories<br />
Year <strong>2010</strong>/11 Year 2011/12 Year 2012/13 Year 2013/14<br />
SWBH City <strong>Sandwell</strong> SWBH City <strong>Sandwell</strong> SWBH City <strong>Sandwell</strong> SWBH City <strong>Sandwell</strong> SWBH<br />
Heading £'s £'s £'s £'s £'s £'s £'s £'s £'s £'s £'s £'s £'s<br />
Income All - 27,875,559 - 16,012,857 - 11,885,962 - 27,898,819 - 16,190,835 - 11,959,919 - 28,150,754 - 16,341,710 - 11,990,795 - 28,332,506 - 16,499,653 - 12,023,022 - 28,522,675<br />
Expenditure<br />
Pay 21,150,110 12,408,888 8,998,676 21,407,564 12,496,098 9,227,665 21,723,762 12,557,527 9,230,294 21,787,820 12,634,918 9,246,085 21,881,003<br />
N Pay 8,454,071 5,140,506 3,540,027 8,680,533 5,169,920 3,563,519 8,733,439 5,183,352 3,588,255 8,771,607 5,197,793 3,613,749 8,811,542<br />
Capital Charges 2,832,238 1,528,588 1,303,649 2,832,238 1,528,588 1,393,038 2,921,626 1,528,588 1,536,885 3,065,473 1,528,588 1,532,609 3,061,197<br />
Total Exenditure 32,436,418 19,077,982 13,842,352 32,920,334 19,194,605 14,184,221 33,378,827 19,269,467 14,355,434 33,624,901 19,361,300 14,392,443 33,753,743<br />
I&E Position 4,560,859 3,065,126 1,956,390 5,021,515 3,003,771 2,224,302 5,228,073 2,927,756 2,364,639 5,292,395 2,861,647 2,369,421 5,231,068<br />
Movement in I&E From 2009/10 20,110 440,546 460,656 - 41,245 708,458 667,213 - 117,259 848,795 731,536 - 183,368 853,577 670,209<br />
Capital Expenditure Needs - 2,424 2,424 932 932 - -<br />
Key Movements<br />
Cumlative<br />
Year 9/10 Year <strong>2010</strong>/11 Year 2011/12 Year 2012/13 Year 2013/14<br />
over 4 years<br />
SWBH City <strong>Sandwell</strong> SWBH City <strong>Sandwell</strong> SWBH City <strong>Sandwell</strong> SWBH City <strong>Sandwell</strong> SWBH SWBH<br />
Heading £'s £'s £'s £'s £'s £'s £'s £'s £'s £'s £'s £'s £'s £'s<br />
Income Prosense V5 - - 247,922 - 31,338 - 279,260 - 177,978 - 73,957 - 251,935 - 150,876 - 30,876 - 181,752 - 157,942 - 32,227 - 190,169<br />
Births Repatriated - - - - -<br />
Catchment Loss - - - - -<br />
Additional Activity - MLU<br />
Other - 189,000 67,000 256,000 - - -<br />
Totall Income - - 58,922<br />
35,662 - 23,260 - 177,978 - 73,957 - 251,935 - 150,876 - 30,876 - 181,752 - 157,942 - 32,227 - 190,169 - 647,116<br />
Expenditure<br />
Prosense V5 173,545 21,937 195,482 124,585 51,770 176,355 105,613 21,613 127,226 110,560 22,559 133,118<br />
Catchment Loss<br />
Births Repatriated<br />
Pay Budget Adjustments - 170,025 - 48,025 - 218,050<br />
- - - - - -<br />
Pay - 75,000 263,667 338,667 0 192,750 192,750 - 12,500 - 12,500 - 25,000<br />
0 0 0<br />
N Pay - 512 167,306 167,817 - 7,961 7,961 0 - 18,251 18,251 - 0 - 18,727 18,727 0<br />
Sub Total Pay & Non-pay - 79,032 404,884 483,916 116,623 252,481 369,105 74,861 27,365 102,226 91,833 41,286 133,118<br />
Capital Charges<br />
- Savings (Maty Block at SGH) - - - - - - - - - - - - -<br />
- Additional - - - - - 89,388 89,388 - 143,848 143,848 - - 4,276 - 4,276<br />
Sub Total Capital Charges - - - - - 89,388 89,388 - 143,848 143,848 - - 4,276 - 4,276<br />
Total Expenditure - 79,032 404,884 483,916 116,623 341,869 458,493 74,861 171,213 246,074 91,833 37,009 128,842 1,317,325<br />
TOTAL MOVEMENT 20,110 440,546 460,656 - 61,355 267,912 206,558 - 76,014 140,336 64,322 - 66,109 4,783 - 61,327 670,209