Trust Board Febuary 2010 - Sandwell & West Birmingham Hospitals
Trust Board Febuary 2010 - Sandwell & West Birmingham Hospitals
Trust Board Febuary 2010 - Sandwell & West Birmingham Hospitals

Create successful ePaper yourself
Turn your PDF publications into a flip-book with our unique Google optimized e-Paper software.
SWBTB (2/10) 045 (b)<br />
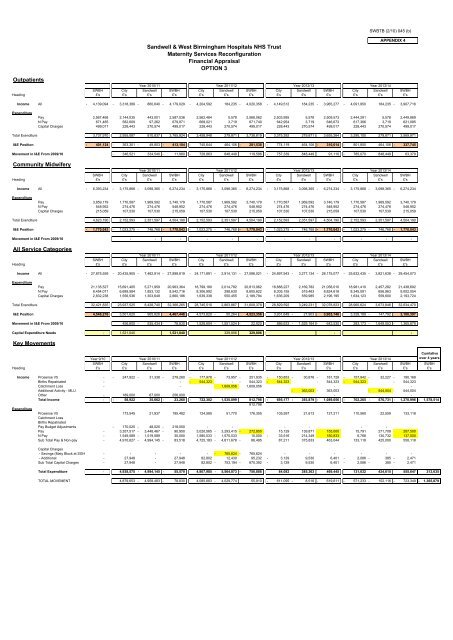
<strong>Sandwell</strong> & <strong>West</strong> <strong>Birmingham</strong> <strong>Hospitals</strong> NHS <strong>Trust</strong><br />
Maternity Services Reconfiguration<br />
Financial Appraisal<br />
OPTION 3<br />
APPENDIX 4<br />
Outpatients<br />
Year <strong>2010</strong>/11 Year 2011/12 Year 2012/13 Year 2013/14<br />
SWBH City <strong>Sandwell</strong> SWBH City <strong>Sandwell</strong> SWBH City <strong>Sandwell</strong> SWBH City <strong>Sandwell</strong> SWBH<br />
Heading £'s £'s £'s £'s £'s £'s £'s £'s £'s £'s £'s £'s £'s<br />
Income All - 4,139,094 - 3,318,389 - 860,640 - 4,179,029 - 4,204,592 184,235 - 4,020,358 - 4,149,512 184,235 - 3,965,277 - 4,091,950 184,235 - 3,907,716<br />
Expenditure<br />
Pay 2,567,468 2,144,035 443,001 2,587,036 2,562,484 5,578 2,568,062 2,503,995 5,578 2,509,573 2,444,291 5,578 2,449,869<br />
N Pay 671,485 582,609 97,262 679,871 668,021 3,719 671,740 642,954 3,719 646,673 617,366 3,719 621,085<br />
Capital Charges 499,017 228,443 270,574 499,017 228,443 270,574 499,017 228,443 270,574 499,017 228,443 270,574 499,017<br />
Total Exenditure 3,737,970 2,955,087 810,837 3,765,924 3,458,948 279,871 3,738,819 3,375,392 279,871 3,655,264 3,290,100 279,871 3,569,971<br />
I&E Position - 401,124 - 363,301 - 49,803 - 413,104 - 745,644 464,106 - 281,538 - 774,119 464,106 - 310,014 - 801,850 464,106 - 337,745<br />
Movement in I&E From 2009/10 - 346,521 334,540 - 11,980 - 728,863 848,449 119,586 - 757,339 848,449 91,110 - 785,070 848,449 63,379<br />
Community Midwifery<br />
Year <strong>2010</strong>/11 Year 2011/12 Year 2012/13 Year 2013/14<br />
SWBH City <strong>Sandwell</strong> SWBH City <strong>Sandwell</strong> SWBH City <strong>Sandwell</strong> SWBH City <strong>Sandwell</strong> SWBH<br />
Heading £'s £'s £'s £'s £'s £'s £'s £'s £'s £'s £'s £'s £'s<br />
Income All - 6,393,234 - 3,175,868 - 3,098,365 - 6,274,234 - 3,175,868 - 3,098,365 - 6,274,234 - 3,175,868 - 3,098,365 - 6,274,234 - 3,175,868 - 3,098,365 - 6,274,234<br />
Expenditure<br />
Pay 3,859,179 1,770,587 1,969,592 3,740,179 1,770,587 1,969,592 3,740,179 1,770,587 1,969,592 3,740,179 1,770,587 1,969,592 3,740,179<br />
N Pay 548,952 274,476 274,476 548,952 274,476 274,476 548,952 274,476 274,476 548,952 274,476 274,476 548,952<br />
Capital Charges 215,059 107,530 107,530 215,059 107,530 107,530 215,059 107,530 107,530 215,059 107,530 107,530 215,059<br />
Total Exenditure 4,623,190 2,152,593 2,351,597 4,504,190 2,152,593 2,351,597 4,504,190 2,152,593 2,351,597 4,504,190 2,152,593 2,351,597 4,504,190<br />
I&E Position - 1,770,043 - 1,023,275 - 746,768 - 1,770,043 - 1,023,275 - 746,768 - 1,770,043 - 1,023,275 - 746,768 - 1,770,043 - 1,023,275 - 746,768 - 1,770,043<br />
Movement in I&E From 2009/10 - - - - - - - - - - - -<br />
All Service Categories<br />
Year <strong>2010</strong>/11 Year 2011/12 Year 2012/13 Year 2013/14<br />
SWBH City <strong>Sandwell</strong> SWBH City <strong>Sandwell</strong> SWBH City <strong>Sandwell</strong> SWBH City <strong>Sandwell</strong> SWBH<br />
Heading £'s £'s £'s £'s £'s £'s £'s £'s £'s £'s £'s £'s £'s<br />
Income All - 27,875,559 - 20,435,905 - 7,462,914 - 27,898,819 - 24,171,891 - 2,914,131 - 27,086,021 - 24,897,943 - 3,277,134 - 28,175,077 - 25,632,435 - 3,821,638 - 29,454,073<br />
Expenditure<br />
Pay 21,135,527 15,691,405 5,271,959 20,963,364 18,799,180 2,014,782 20,813,962 18,888,227 2,169,782 21,058,010 18,981,410 2,457,282 21,438,692<br />
N Pay 8,454,071 6,689,584 1,853,132 8,542,716 8,306,992 298,630 8,605,622 8,305,155 519,463 8,824,618 8,345,091 656,963 9,002,054<br />
Capital Charges 2,832,238 1,556,536 1,303,649 2,860,186 1,639,338 550,455 2,189,794 1,636,209 559,985 2,196,195 1,634,123 559,600 2,193,724<br />
Total Exenditure 32,421,835 23,937,525 8,428,740 32,366,265 28,745,510 2,863,867 31,609,378 28,829,592 3,249,231 32,078,823 28,960,624 3,673,846 32,634,470<br />
I&E Position 4,546,276 3,501,620 965,826 4,467,446 4,573,620 - 50,264 4,523,356 3,931,649 - 27,903 3,903,746 3,328,189 - 147,792 3,180,397<br />
Movement in I&E From 2009/10 456,605 - 535,434 - 78,830 1,528,604 - 1,551,524 - 22,920 886,633 - 1,529,164 - 642,530 283,173 - 1,649,053 - 1,365,879<br />
Capital Expenditure Needs - 1,521,040 1,521,040 329,806 329,806 - -<br />
Key Movements<br />
Cumlative<br />
Year 9/10 Year <strong>2010</strong>/11 Year 2011/12 Year 2012/13 Year 2013/14<br />
over 4 years<br />
SWBH City <strong>Sandwell</strong> SWBH City <strong>Sandwell</strong> SWBH City <strong>Sandwell</strong> SWBH City <strong>Sandwell</strong> SWBH SWBH<br />
Heading £'s £'s £'s £'s £'s £'s £'s £'s £'s £'s £'s £'s £'s £'s<br />
Income Prosense V5 - - 247,922 - 31,338 - 279,260 - 177,978 - 73,957 - 251,935 - 150,853 - 30,876 - 181,729 - 157,942 - 32,227 - 190,169<br />
Births Repatriated - - - 544,323<br />
- - 544,323 - 544,323<br />
- 544,323 - 544,323<br />
- 544,323<br />
Catchment Loss - - 1,609,056 1,609,056 - -<br />
Additional Activity - MLU - 363,003 - 363,003<br />
- 544,504 - 544,504<br />
Other - 189,000 67,000 256,000 - - -<br />
Total Income - - 58,922 35,662 - 23,260 - 722,302 1,535,099 812,798 - 695,177 - 393,879 - 1,089,056 - 702,265 - 576,731 - 1,278,996 - 1,578,514<br />
812,798<br />
Expenditure<br />
Prosense V5 173,545 21,937 195,482 124,585 51,770 176,355 105,597 21,613 127,211 110,560 22,559 133,118<br />
Catchment Loss<br />
Births Repatriated<br />
Pay Budget Adjustments - 170,025 - 48,025 - 218,050<br />
- - - - - -<br />
Pay - 3,357,517 - 3,448,467 - 90,950 3,020,565 - 3,293,415 - 272,850 15,129 139,871 155,000 15,791 271,709 287,500<br />
N Pay - 1,549,589 - 1,519,589 30,000 1,580,033 - 1,570,033 10,000 - 33,516 214,349 180,833 6,768 130,732 137,500<br />
Sub Total Pay & Non-pay - 4,910,627 - 4,994,145 - 83,518 4,725,183 - 4,811,678 - 86,495 87,211 375,833 463,044 133,118 425,000 558,118<br />
Capital Charges<br />
- Savings (Maty Block at SGH) - - - - - - 765,624 - 765,624<br />
- - - - - -<br />
- Additional - 27,948 - 27,948 82,802 12,430 95,232 - 3,129 9,530 6,401 - 2,086 - 385 - 2,471<br />
Sub Total Capital Charges - 27,948 - 27,948 82,802 - 753,194 - 670,392 - 3,129 9,530 6,401 - 2,086 - 385 - 2,471<br />
Total Expenditure - 4,938,575 - 4,994,145 - 55,570 4,807,985 - 5,564,873 - 756,888 84,082 385,363 469,445 131,032 424,615 555,647 212,635<br />
TOTAL MOVEMENT 4,879,653 - 4,958,483 - 78,830 4,085,683 - 4,029,774 55,910 - 611,095 - 8,516 - 619,611 - 571,233 - 152,116 - 723,349 - 1,365,879