Trust Board Febuary 2010 - Sandwell & West Birmingham Hospitals
Trust Board Febuary 2010 - Sandwell & West Birmingham Hospitals
Trust Board Febuary 2010 - Sandwell & West Birmingham Hospitals

You also want an ePaper? Increase the reach of your titles
YUMPU automatically turns print PDFs into web optimized ePapers that Google loves.
SWBTB (2/10) 031 (a)<br />
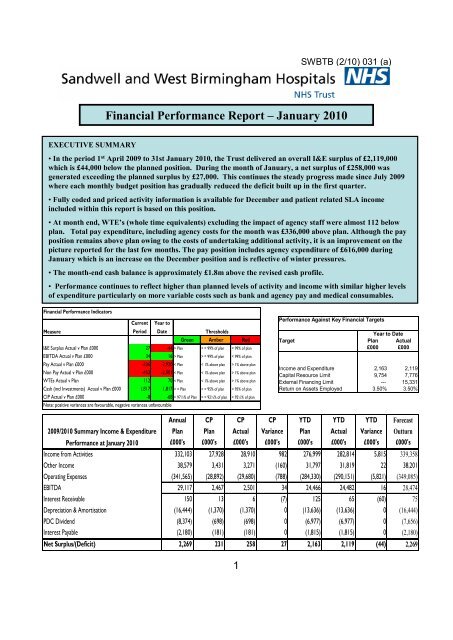
Financial Performance Report – January <strong>2010</strong><br />
EXECUTIVE SUMMARY<br />
• In the period 1 st April 2009 to 31st January <strong>2010</strong>, the <strong>Trust</strong> delivered an overall I&E surplus of £2,119,000<br />
which is £44,000 below the planned position. During the month of January, a net surplus of £258,000 was<br />
generated exceeding the planned surplus by £27,000. This continues the steady progress made since July 2009<br />
where each monthly budget position has gradually reduced the deficit built up in the first quarter.<br />
• Fully coded and priced activity information is available for December and patient related SLA income<br />
included within this report is based on this position.<br />
• At month end, WTE’s (whole time equivalents) excluding the impact of agency staff were almost 112 below<br />
plan. Total pay expenditure, including agency costs for the month was £336,000 above plan. Although the pay<br />
position remains above plan owing to the costs of undertaking additional activity, it is an improvement on the<br />
picture reported for the last few months. The pay position includes agency expenditure of £616,000 during<br />
January which is an increase on the December position and is reflective of winter pressures.<br />
• The month-end cash balance is approximately £1.8m above the revised cash profile.<br />
• Performance continues to reflect higher than planned levels of activity and income with similar higher levels<br />
of expenditure particularly on more variable costs such as bank and agency pay and medical consumables.<br />
Financial Performance Indicators<br />
Measure<br />
Current<br />
Period<br />
Year to<br />
Date<br />
Thresholds<br />
Green Amber Red<br />
I&E Surplus Actual v Plan £000 27 -44 > Plan > = 99% of plan < 99% of plan<br />
EBITDA Actual v Plan £000 34 16 > Plan > = 99% of plan < 99% of plan<br />
Pay Actual v Plan £000 -336 -2,920 < Plan < 1% above plan > 1% above plan<br />
Non Pay Actual v Plan £000 -452 -2,901 < Plan < 1% above plan > 1% above plan<br />
WTEs Actual v Plan 112 70 < Plan < 1% above plan > 1% above plan<br />
Cash (incl Investments) Actual v Plan £000 1,817 1,817 > = Plan > = 95% of plan < 95% of plan<br />
CIP Actual v Plan £000 -8 -68 > 97½% of Plan > = 92½% of plan < 92½% of plan<br />
Note: positive variances are favourable, negative variances unfavourable<br />
Performance Against Key Financial Targets<br />
Year to Date<br />
Target Plan Actual<br />
£000 £000<br />
Income and Expenditure 2,163 2,119<br />
Capital Resource Limit 9,754 7,776<br />
External Financing Limit --- 15,331<br />
Return on Assets Employed 3.50% 3.50%<br />
2009/<strong>2010</strong> Summary Income & Expenditure<br />
Performance at January <strong>2010</strong><br />
Annual CP CP CP YTD YTD YTD Forecast<br />
Plan Plan Actual Variance Plan Actual Variance Outturn<br />
£000's £000's £000's £000's £000's £000's £000's £000's<br />
Income from Activities 332,103 27,928 28,910 982 276,999 282,814 5,815 339,358<br />
Other Income 38,579 3,431 3,271 (160) 31,797 31,819 22 38,201<br />
Operating Expenses (341,565) (28,892) (29,680) (788) (284,330) (290,151) (5,821) (349,085)<br />
EBITDA 29,117 2,467 2,501 34 24,466 24,482 16 28,474<br />
Interest Receivable 150 13 6 (7) 125 65 (60) 75<br />
Depreciation & Amortisation (16,444) (1,370) (1,370) 0 (13,636) (13,636) 0 (16,444)<br />
PDC Dividend (8,374) (698) (698) 0 (6,977) (6,977) 0 (7,656)<br />
Interest Payable (2,180) (181) (181) 0 (1,815) (1,815) 0 (2,180)<br />
Net Surplus/(Deficit) 2,269 231 258 27 2,163 2,119 (44) 2,269<br />
1