Trust Board Febuary 2010 - Sandwell & West Birmingham Hospitals
Trust Board Febuary 2010 - Sandwell & West Birmingham Hospitals
Trust Board Febuary 2010 - Sandwell & West Birmingham Hospitals

You also want an ePaper? Increase the reach of your titles
YUMPU automatically turns print PDFs into web optimized ePapers that Google loves.
SWBTB (2/10) 042 (a)<br />
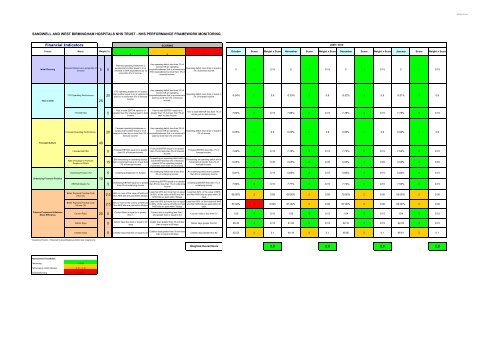
SANDWELL AND WEST BIRMINGHAM HOSPITALS NHS TRUST - NHS PERFORMANCE FRAMEWORK MONITORING<br />
Financial Indicators<br />
SCORING<br />
2009 / <strong>2010</strong><br />
Criteria Metric Weight (%)<br />
October Score Weight x Score November Score Weight x Score December Score Weight x Score January Score Weight x Score<br />
3 2 1<br />
Initial Planning<br />
Planned Outturn as a proportion of<br />
turnover 5 5<br />
Any operating deficit less than 2% of<br />
Planned operating breakeven or<br />
income OR an operating<br />
surplus that is either equal to or at<br />
Operating deficit more than or equal to<br />
surplus/breakeven that is at variance to<br />
variance to SHA expectations by no<br />
2% of planned income<br />
SHA expectations by more than 3% of<br />
more than 3% of income.<br />
planned income.<br />
0 3 0.15<br />
0 3 0.15<br />
0 3 0.15<br />
0 3 0.15<br />
Year to Date<br />
YTD Operating Performance<br />
25<br />
20<br />
Any operating deficit less than 2% of<br />
YTD operating breakeven or surplus<br />
income OR an operating<br />
that is either equal to or at variance to<br />
Operating deficit more than or equal to<br />
surplus/breakeven that is at variance to<br />
plan by no more than 3% of forecast<br />
2% of forecast income<br />
plan by more than 3% of forecast<br />
income.<br />
income.<br />
-0.04% 3 0.6<br />
-0.03% 3 0.6<br />
-0.02% 3 0.6<br />
-0.01% 3 0.6<br />
YTD EBITDA 5<br />
Year to date EBITDA equal to or<br />
greater than 5% of actual year to date<br />
income<br />
Year to date EBITDA equal to or<br />
greater than 1% but less than 5% of<br />
year to date income<br />
Year to date EBITDA less than 1% of<br />
actual year to date income.<br />
7.80% 3 0.15<br />
7.86% 3 0.15<br />
7.78% 3 0.15<br />
7.78% 3 0.15<br />
Forecast operating breakeven or<br />
Any operating deficit less than 2% of<br />
Forecast Operating Performance<br />
20<br />
surplus that is either equal to or at income OR an operating Operating deficit more than or equal to<br />
variance to plan by no more than 3% of surplus/breakeven that is at variance to<br />
2% of income<br />
0.00% 3 0.6<br />
0.00% 3 0.6<br />
0.00% 3 0.6<br />
0.00% 3 0.6<br />
forecast income.<br />
plan by more than 3% of income.<br />
Forecast Outturn<br />
40<br />
Forecast EBITDA 5<br />
Forecast EBITDA equal to or greater<br />
than 5% of forecast income.<br />
Forecast EBITDA equal to or greater<br />
than 1% but less than 5% of forecast<br />
income.<br />
Forecast EBITDA less than 1% of<br />
forecast income.<br />
7.69% 3 0.15<br />
7.76% 3 0.15<br />
7.73% 3 0.15<br />
7.54% 3 0.15<br />
Rate of Change in Forecast<br />
Surplus or Deficit<br />
15<br />
Forecasting an operating deficit with a<br />
Still forecasting an operating surplus<br />
Forecasting an operating deficit with a<br />
movement less than 2% of forecast<br />
with a movement equal to or less than<br />
movement of greater than 2% of<br />
income OR an operating surplus<br />
3% of forecast income<br />
forecast income.<br />
movement more than 3% of income.<br />
0.00% 3 0.45<br />
0.00% 3 0.45<br />
0.00% 3 0.45<br />
0.00% 3 0.45<br />
Underlying Position (%)<br />
5<br />
Underlying breakeven or Surplus<br />
An underlying deficit that is less than<br />
2% of underlying income.<br />
An underlying deficit that is greater<br />
than 2% of underlying income<br />
0.61% 3 0.15<br />
0.60% 3 0.15<br />
0.60% 3 0.15<br />
0.60% 3 0.15<br />
Underlying Financial Position<br />
10<br />
EBITDA Margin (%) 5<br />
Underlying EBITDA equal to or greater<br />
Underlying EBITDA equal to or greater<br />
than 5% but less than 1% of underlying<br />
than 5% of underlying income<br />
income<br />
Underlying EBITDA less than 1% of<br />
underlying income<br />
7.69% 3 0.15<br />
7.77% 3 0.15<br />
7.74% 3 0.15<br />
7.55% 3 0.15<br />
Better Payment Practice Code<br />
Value (%)<br />
2.5<br />
Less than 95% but more than or equal Less than 60% of the value of NHS<br />
95% or more of the value of NHS and<br />
to 60% of the value of NHS and Non and Non NHS bills are paid within 30<br />
Non NHS bills are paid within 30days<br />
NHS bills are paid within 30days<br />
days<br />
68.00% 2 0.05<br />
69.00% 2 0.05<br />
70.00% 2 0.05<br />
69.00% 2 0.05<br />
Better Payment Practice Code<br />
Volume (%)<br />
2.5<br />
Less than 95% but more than or equal Less than 60% of the volume of NHS<br />
95% or more of the volume of NHS and<br />
to 60% of the volume of NHS and Non and Non NHS bills are paid within 30<br />
Non NHS bills are paid within 30days<br />
NHS bills are paid within 30days<br />
days<br />
57.00% 1 0.025<br />
67.00% 2 0.05<br />
67.00% 2 0.05<br />
62.00% 2 0.05<br />
Finance Processes & Balance<br />
Sheet Efficiency<br />
Current Ratio 20 5<br />
Current Ratio is equal to or greater<br />
than 1.<br />
Current ratio is anything less than 1<br />
and greater than or equal to 0.5<br />
A current ratio of less than 0.5<br />
1.05 3 0.15<br />
1.05 3 0.15<br />
1.04 3 0.15<br />
1.04 3 0.15<br />
Debtor Days 5<br />
Debtor days less than or equal to 30<br />
days<br />
Debtor days greater than 30 and less<br />
than or equal to 60 days<br />
Debtor days greater than 60<br />
20.35 3 0.15<br />
21.00 3 0.15<br />
22.10 3 0.15<br />
22.76 3 0.15<br />
Creditor Days 5 Creditor days less than or equal to 30<br />
Creditor days greater than 30 and less<br />
than or equal to 60 days<br />
Creditor days greater than 60<br />
42.53 2 0.1<br />
44.19 2 0.1<br />
46.80 2 0.1<br />
46.61 2 0.1<br />
*Operating Position = Retained Surplus/Breakeven/deficit less impairments<br />
Weighted Overall Score<br />
2.9<br />
2.9<br />
2.9<br />
2.9<br />
Assessment Thresholds<br />
Performing > 2.40<br />
Performance Under Review 2.10 - 2.40<br />
Underperforming < 2.10