SWBTB (2/10) 045 (b) Financial Appraisal OPTION 1 nts Year <strong>2010</strong>/11 Year 2011/12 Year 2012/13 Year 2013/14 SWBH City <strong>Sandwell</strong> SWBH City <strong>Sandwell</strong> SWBH City <strong>Sandwell</strong> SWBH City <strong>Sandwell</strong> SWBH £'s £'s £'s £'s £'s £'s £'s £'s £'s £'s £'s £'s £'s All - 4,139,094 - 3,318,389 - 860,640 - 4,179,029 - 4,020,358 - - 4,020,358 - 3,965,277 - - 3,965,277 - 3,907,716 - - 3,907,716 Pay 2,567,468 2,144,035 443,001 2,587,036 2,562,484 5,578 2,568,062 2,503,995 5,578 2,509,573 2,444,291 5,578 2,449,869 N Pay 671,485 582,609 97,262 679,871 668,021 3,719 671,740 642,954 3,719 646,673 617,366 3,719 621,085 Capital Charges 499,017 228,443 270,574 499,017 228,443 270,574 499,017 228,443 270,574 499,017 228,443 270,574 499,017 3,737,970 2,955,087 810,837 3,765,924 3,458,948 279,871 3,738,819 3,375,392 279,871 3,655,264 3,290,100 279,871 3,569,971 - 401,124 - 363,301 - 49,803 - 413,104 - 561,410 279,871 - 281,538 - 589,885 279,871 - 310,014 - 617,616 279,871 - 337,745 &E From 2009/10 - 346,521 334,540 - 11,980 - 544,629 664,215 119,586 - 573,104 664,215 91,110 - 600,835 664,215 63,379 ommunity Midwifery Year <strong>2010</strong>/11 Year 2011/12 Year 2012/13 Year 2013/14 SWBH City <strong>Sandwell</strong> SWBH City <strong>Sandwell</strong> SWBH City <strong>Sandwell</strong> SWBH City <strong>Sandwell</strong> SWBH £'s £'s £'s £'s £'s £'s £'s £'s £'s £'s £'s £'s £'s All - 23,736,465 - 17,117,516 - 6,602,274 - 23,719,790 - 19,967,298 - 3,098,365 - 23,065,663 - 20,748,431 - 3,098,365 - 23,846,797 - 21,540,485 - 3,098,365 - 24,638,851 Pay 18,582,642 13,507,758 4,868,570 18,376,328 16,229,961 2,015,938 18,245,900 16,377,498 2,015,938 18,393,436 16,530,385 2,015,938 18,546,324 N Pay 7,782,586 6,117,437 1,745,408 7,862,845 7,628,509 305,374 7,933,882 7,651,738 305,374 7,957,112 7,717,262 305,374 8,022,635 Capital Charges 2,333,220 1,328,094 1,033,075 2,361,169 1,410,896 279,881 1,690,776 1,407,767 289,411 1,697,177 1,405,681 289,026 1,694,706 re 28,698,448 20,953,288 7,647,053 28,600,341 25,269,366 2,601,193 27,870,558 25,437,003 2,610,723 28,047,726 25,653,328 2,610,338 28,263,666 4,961,984 3,835,771 1,044,779 4,880,551 5,302,067 - 497,173 4,804,895 4,688,572 - 487,643 4,200,929 4,112,843 - 488,027 3,624,815 I&E From 2009/10 773,975 - 855,408 - 81,433 2,240,271 - 2,397,360 - 157,089 1,626,775 - 2,387,830 - 761,055 1,051,046 - 2,388,215 - 1,337,168 ce Categories Year <strong>2010</strong>/11 Year 2011/12 Year 2012/13 Year 2013/14 SWBH City <strong>Sandwell</strong> SWBH City <strong>Sandwell</strong> SWBH City <strong>Sandwell</strong> SWBH City <strong>Sandwell</strong> SWBH £'s £'s £'s £'s £'s £'s £'s £'s £'s £'s £'s £'s £'s All - 27,875,559 - 20,435,905 - 7,462,914 - 27,898,819 - 23,987,656 - 3,098,365 - 27,086,021 - 24,713,709 - 3,098,365 - 27,812,074 - 25,448,201 - 3,098,365 - 28,546,566 Pay 21,150,110 15,651,793 5,311,571 20,963,364 18,792,446 2,021,516 20,813,962 18,881,493 2,021,516 20,903,010 18,974,676 2,021,516 20,996,192 N Pay 8,454,071 6,700,046 1,842,670 8,542,716 8,296,529 309,092 8,605,622 8,294,693 309,092 8,603,785 8,334,628 309,092 8,643,721 Capital Charges 2,832,238 1,556,536 1,303,649 2,860,186 1,639,338 550,455 2,189,794 1,636,209 559,985 2,196,195 1,634,123 559,600 2,193,724 32,436,418 23,908,375 8,457,890 32,366,265 28,728,314 2,881,064 31,609,378 28,812,395 2,890,594 31,702,989 28,943,428 2,890,209 31,833,637 4,560,859 3,472,470 994,976 4,467,446 4,740,658 - 217,302 4,523,356 4,098,687 - 207,771 3,890,915 3,495,227 - 208,156 3,287,071 &E From 2009/10 427,455 - 520,868 - 93,413 1,695,642 - 1,733,146 - 37,503 1,053,671 - 1,723,616 - 669,944 450,211 - 1,724,000 - 1,273,789 diture Needs - 1,521,040 1,521,040 329,806 329,806 - - ements Cumlative Year 9/10 Year <strong>2010</strong>/11 Year 2011/12 Year 2012/13 Year 2013/14 over 4 years SWBH City <strong>Sandwell</strong> SWBH City <strong>Sandwell</strong> SWBH City <strong>Sandwell</strong> SWBH City <strong>Sandwell</strong> SWBH SWBH £'s £'s £'s £'s £'s £'s £'s £'s £'s £'s £'s £'s £'s £'s Prosense V5 - - 247,922 - 31,338 - 279,260 - 177,978 - 73,957 - 251,935 - 150,853 - 30,876 - 181,729 - 157,942 - 32,227 - 190,169 Births & Related OP Repatriated - - - 544,323 - - 544,323 - 544,323 - - 544,323 - 544,323 - - 544,323 Catchment Loss - - 1,609,056 1,609,056 - - Additional Activity - MLU Other - 189,000 67,000 256,000 - - - Total Income - - 58,922 35,662 - 23,260 - 722,302 1,535,099 812,798 - 695,177 - 30,876 - 726,053 - 702,265 - 32,227 - 734,492 - 671,007 Prosense V5 173,545 21,937 195,482 124,585 51,770 176,355 105,597 21,613 127,211 110,560 22,559 133,118 Catchment Loss Births Repatriated Pay Budget Adjustments - 170,025 - 48,025 - 218,050 - - - - - - Pay - 3,317,905 - 3,423,438 - 105,533 3,053,444 - 3,326,294 - 272,850 15,129 - 15,129 0 15,791 - 15,791 - 0 N Pay - 1,560,052 - 1,530,052 30,000 1,559,108 - 1,549,108 10,000 - 33,516 - 6,484 - 40,000 6,768 - 6,768 0 Sub Total Pay & Non-pay - 4,881,477 - 4,979,578 - 98,101 4,737,136 - 4,823,632 - 86,495 87,211 0 87,211 133,118 - 133,118 Capital Charges - Savings (Maty Block at SGH) - - - - - - 765,624 - 765,624 - - - - - - - Additional - 27,948 - 27,948 82,802 12,430 95,232 - 3,129 9,530 6,401 - 2,086 - 385 - 2,471 Sub Total Capital Charges - 27,948 - 27,948 82,802 - 753,194 - 670,392 - 3,129 9,530 6,401 - 2,086 - 385 - 2,471 Total Expenditure - 4,909,425 - 4,979,578 - 70,153 4,819,938 - 5,576,826 - 756,888 84,082 9,530 93,612 131,032 - 385 130,647 - 602,782 TOTAL MOVEMENT 4,850,503 - 4,943,916 - 93,413 4,097,637 - 4,041,727 55,910 - 611,095 - 21,346 - 632,441 - 571,233 - 32,611 - 603,845 - 1,273,789
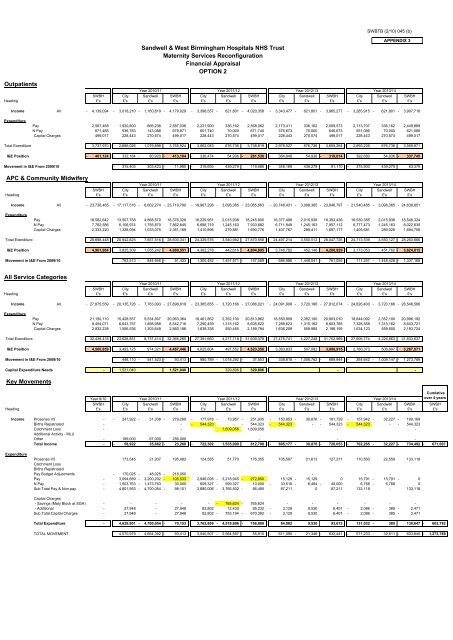
SWBTB (2/10) 045 (b) <strong>Sandwell</strong> & <strong>West</strong> <strong>Birmingham</strong> <strong>Hospitals</strong> NHS <strong>Trust</strong> Maternity Services Reconfiguration Financial Appraisal OPTION 2 APPENDIX 3 Outpatients Year <strong>2010</strong>/11 Year 2011/12 Year 2012/13 Year 2013/14 SWBH City <strong>Sandwell</strong> SWBH City <strong>Sandwell</strong> SWBH City <strong>Sandwell</strong> SWBH City <strong>Sandwell</strong> SWBH Heading £'s £'s £'s £'s £'s £'s £'s £'s £'s £'s £'s £'s £'s Income All - 4,139,094 - 3,018,210 - 1,160,819 - 4,179,029 - 3,398,557 - 621,801 - 4,020,358 - 3,343,477 - 621,801 - 3,965,277 - 3,285,915 - 621,801 - 3,907,716 Expenditure Pay 2,567,468 1,920,800 666,236 2,587,036 2,231,900 336,162 2,568,062 2,173,411 336,162 2,509,573 2,113,707 336,162 2,449,869 N Pay 671,485 536,783 143,088 679,871 601,740 70,000 671,740 576,673 70,000 646,673 551,086 70,000 621,085 Capital Charges 499,017 228,443 270,574 499,017 228,443 270,574 499,017 228,443 270,574 499,017 228,443 270,574 499,017 Total Exenditure 3,737,970 2,686,026 1,079,898 3,765,924 3,062,083 676,736 3,738,819 2,978,527 676,736 3,655,264 2,893,235 676,736 3,569,971 I&E Position - 401,124 - 332,184 - 80,920 - 413,104 - 336,474 54,936 - 281,538 - 364,949 54,936 - 310,014 - 392,680 54,936 - 337,745 Movement in I&E From 2009/10 - 315,403 303,423 - 11,980 - 319,693 439,279 119,586 - 348,169 439,279 91,110 - 375,900 439,279 63,379 APC & Community Midwifery Year <strong>2010</strong>/11 Year 2011/12 Year 2012/13 Year 2013/14 SWBH City <strong>Sandwell</strong> SWBH City <strong>Sandwell</strong> SWBH City <strong>Sandwell</strong> SWBH City <strong>Sandwell</strong> SWBH Heading £'s £'s £'s £'s £'s £'s £'s £'s £'s £'s £'s £'s £'s Income All - 23,736,465 - 17,117,516 - 6,602,274 - 23,719,790 - 19,967,298 - 3,098,365 - 23,065,663 - 20,748,431 - 3,098,365 - 23,846,797 - 21,540,485 - 3,098,365 - 24,638,851 Expenditure Pay 18,582,642 13,507,758 4,868,570 18,376,328 16,229,961 2,015,938 18,245,900 16,377,498 2,015,938 18,393,436 16,530,385 2,015,938 18,546,324 N Pay 7,782,586 6,106,974 1,755,870 7,862,845 6,688,719 1,245,163 7,933,882 6,711,949 1,245,163 7,957,112 6,777,473 1,245,163 8,022,635 Capital Charges 2,333,220 1,328,094 1,033,075 2,361,169 1,410,896 279,881 1,690,776 1,407,767 289,411 1,697,177 1,405,681 289,026 1,694,706 Total Exenditure 28,698,448 20,942,825 7,657,516 28,600,341 24,329,576 3,540,982 27,870,558 24,497,214 3,550,512 28,047,726 24,713,539 3,550,127 28,263,666 I&E Position 4,961,984 3,825,309 1,055,242 4,880,551 4,362,278 442,616 4,804,895 3,748,782 452,146 4,200,929 3,173,053 451,762 3,624,815 Movement in I&E From 2009/10 763,513 - 844,946 - 81,433 1,300,482 - 1,457,571 - 157,089 686,986 - 1,448,041 - 761,055 111,257 - 1,448,426 - 1,337,168 All Service Categories Year <strong>2010</strong>/11 Year 2011/12 Year 2012/13 Year 2013/14 SWBH City <strong>Sandwell</strong> SWBH City <strong>Sandwell</strong> SWBH City <strong>Sandwell</strong> SWBH City <strong>Sandwell</strong> SWBH Heading £'s £'s £'s £'s £'s £'s £'s £'s £'s £'s £'s £'s £'s Income All - 27,875,559 - 20,135,726 - 7,763,093 - 27,898,819 - 23,365,855 - 3,720,166 - 27,086,021 - 24,091,908 - 3,720,166 - 27,812,074 - 24,826,400 - 3,720,166 - 28,546,566 Expenditure Pay 21,150,110 15,428,557 5,534,807 20,963,364 18,461,862 2,352,100 20,813,962 18,550,909 2,352,100 20,903,010 18,644,092 2,352,100 20,996,192 N Pay 8,454,071 6,643,757 1,898,958 8,542,716 7,290,459 1,315,162 8,605,622 7,288,623 1,315,162 8,603,785 7,328,558 1,315,162 8,643,721 Capital Charges 2,832,238 1,556,536 1,303,649 2,860,186 1,639,338 550,455 2,189,794 1,636,209 559,985 2,196,195 1,634,123 559,600 2,193,724 Total Exenditure 32,436,418 23,628,851 8,737,414 32,366,265 27,391,660 4,217,718 31,609,378 27,475,741 4,227,248 31,702,989 27,606,774 4,226,863 31,833,637 I&E Position 4,560,859 3,493,125 974,321 4,467,446 4,025,804 497,552 4,523,356 3,383,833 507,082 3,890,915 2,780,373 506,697 3,287,071 Movement in I&E From 2009/10 448,110 - 541,523 - 93,413 980,789 - 1,018,292 - 37,503 338,818 - 1,008,762 - 669,944 - 264,642 - 1,009,147 - 1,273,789 Capital Expenditure Needs - 1,521,040 1,521,040 329,806 329,806 - - Key Movements Cumlative Year 9/10 Year <strong>2010</strong>/11 Year 2011/12 Year 2012/13 Year 2013/14 over 4 years SWBH City <strong>Sandwell</strong> SWBH City <strong>Sandwell</strong> SWBH City <strong>Sandwell</strong> SWBH City <strong>Sandwell</strong> SWBH SWBH Heading £'s £'s £'s £'s £'s £'s £'s £'s £'s £'s £'s £'s £'s £'s Income Prosense V5 - - 247,922 - 31,338 - 279,260 - 177,978 - 73,957 - 251,935 - 150,853 - 30,876 - 181,729 - 157,942 - 32,227 - 190,169 Births Repatriated - - - 544,323 - - 544,323 - 544,323 - - 544,323 - 544,323 - - 544,323 Catchment Loss - - 1,609,056 1,609,056 - - Additional Activity - MLU Other - 189,000 67,000 256,000 - - - Total Income - - 58,922 35,662 - 23,260 - 722,302 1,535,099 812,798 - 695,177 - 30,876 - 726,053 - 702,265 - 32,227 - 734,492 - 671,007 Expenditure Prosense V5 173,545 21,937 195,482 124,585 51,770 176,355 105,597 21,613 127,211 110,560 22,559 133,118 Catchment Loss Births Repatriated Pay Budget Adjustments - 170,025 - 48,025 - 218,050 - - - - - - Pay - 3,094,669 - 3,200,202 - 105,533 2,946,095 - 3,218,945 - 272,850 15,129 - 15,129 0 15,791 - 15,791 - 0 N Pay - 1,503,763 - 1,473,763 30,000 609,327 - 599,327 10,000 - 33,516 - 6,484 - 40,000 6,768 - 6,768 0 Sub Total Pay & Non-pay - 4,601,953 - 4,700,054 - 98,101 3,680,006 - 3,766,502 - 86,495 87,211 0 87,211 133,118 - 133,118 Capital Charges - Savings (Maty Block at SGH) - - - - - - 765,624 - 765,624 - - - - - - - Additional - 27,948 - 27,948 82,802 12,430 95,232 - 3,129 9,530 6,401 - 2,086 - 385 - 2,471 Sub Total Capital Charges - 27,948 - 27,948 82,802 - 753,194 - 670,392 - 3,129 9,530 6,401 - 2,086 - 385 - 2,471 Total Expenditure - 4,629,901 - 4,700,054 - 70,153 3,762,809 - 4,519,696 - 756,888 84,082 9,530 93,612 131,032 - 385 130,647 - 602,782 TOTAL MOVEMENT 4,570,979 - 4,664,392 - 93,413 3,040,507 - 2,984,597 55,910 - 611,095 - 21,346 - 632,441 - 571,233 - 32,611 - 603,845 - 1,273,789
- Page 1 and 2:
SWBTB (2/10) 026 AGENDA Trust Board
- Page 3 and 4:
SWBTB (2/10) 026 18 Any other busin
- Page 5 and 6:
MINUTES approved as true and accura
- Page 7 and 8:
MINUTES expectation that there woul
- Page 9 and 10:
MINUTES however the structure would
- Page 11 and 12:
MINUTES which was reported to be un
- Page 13 and 14:
MINUTES Mr Cash asked which communi
- Page 15 and 16:
MINUTES Mr Seager presented an upda
- Page 17 and 18:
SWBTB (2/10) 025 (a) Next Meeting:
- Page 19 and 20:
SWBTB (2/10) 035 TRUST BOARD DOCUME
- Page 21 and 22:
SWBTB (2/10) 035 PREVIOUS CONSIDERA
- Page 23 and 24:
SWBTB (2/10) 035 (a) Contents Page
- Page 25 and 26:
SWBTB (2/10) 035 (a) 2. Methodology
- Page 27 and 28:
SWBTB (2/10) 035 (a) 2.3 Reach 780
- Page 29 and 30:
SWBTB (2/10) 035 (a) 7
- Page 31 and 32:
SWBTB (2/10) 035 (a) 3. Option Pref
- Page 33 and 34:
SWBTB (2/10) 035 (a) Table 3 Comple
- Page 35 and 36:
SWBTB (2/10) 035 (a) • A number o
- Page 37 and 38:
SWBTB (2/10) 035 (a) • Satisfied
- Page 39 and 40:
SWBTB (2/10) 035 (a) • Bad experi
- Page 41 and 42:
SWBTB (2/10) 035 (a) Table 5 Focus
- Page 43 and 44:
SWBTB (2/10) 035 (a) Some women kne
- Page 45 and 46:
SWBTB (2/10) 035 (a) • Reputation
- Page 47 and 48:
SWBTB (2/10) 035 (a) Young people p
- Page 49 and 50:
SWBTB (2/10) 035 (a) Table 7 Showin
- Page 51 and 52:
SWBTB (2/10) 035 (a) home birth wou
- Page 53 and 54:
SWBTB (2/10) 035 (a) Black Caribbea
- Page 55 and 56:
SWBTB (2/10) 035 (a) White and Blac
- Page 57 and 58:
SWBTB (2/10) 035 (a) • Labour Par
- Page 59 and 60:
SWBTB (2/10) 035 (a) Role Number of
- Page 61 and 62:
SWBTB (2/10) 035 (a) Appendix 1 Foc
- Page 63 and 64:
SWBTB (2/10) 035 (a) Appendix 2 Pro
- Page 65 and 66:
SWBTB (2/10) 035 (a) Postcode Area
- Page 67 and 68:
SWBTB (2/10) 035 (a) Chart 2: Women
- Page 69 and 70: SWBTB (2/10) 035 (a) Chart 6: Women
- Page 71 and 72: SWBTB (2/10) 035 (a) Chart 10: Wome
- Page 73 and 74: SWBTB (2/10) 035 (a) Appendix 5 Com
- Page 75 and 76: SWBTB (2/10) 035 (a) Appendix 7 Bir
- Page 77 and 78: SWBTB (2/10) 045 TRUST BOARD DOCUME
- Page 79 and 80: SWBTB (2/10) 045 IMPACT ASSESSMENT
- Page 81 and 82: SWBTB (2/10) 045 (a) MATERNITY SERV
- Page 83 and 84: SWBTB (2/10) 045 (a) All consultant
- Page 85 and 86: SWBTB (2/10) 045 (a) • APPROVE th
- Page 87 and 88: SWBTB (2/10) 045 (a) strategy the S
- Page 89 and 90: SWBTB (2/10) 045 (a) These efforts
- Page 91 and 92: SWBTB (2/10) 045 (a) risk women in
- Page 93 and 94: SWBTB (2/10) 045 (a) • Shorter la
- Page 95 and 96: SWBTB (2/10) 045 (a) Benefit Descri
- Page 97 and 98: SWBTB (2/10) 045 (a) From the compl
- Page 99 and 100: SWBTB (2/10) 045 (a) Concerns about
- Page 101 and 102: SWBTB (2/10) 045 (a) Stages 5 - 9:
- Page 103 and 104: SWBTB (2/10) 045 (a) The scheme dur
- Page 105 and 106: SWBTB (2/10) 045 (a) • The stand
- Page 107 and 108: SWBTB (2/10) 045 (a) 10. INVESTMENT
- Page 109 and 110: SWBTB (2/10) 045 (a) 11.2 Activity
- Page 111 and 112: SWBTB (2/10) 045 (a) 13. CASHFLOW P
- Page 113 and 114: SWBTB (2/10) 045 (a) 15. JOINT HEAL
- Page 115 and 116: SWBTB (2/10) 045 (a) Sandwell PCT w
- Page 117 and 118: SWBTB (2/10) 045 (a) APPENDIX 7 DOC
- Page 119: SWBTB (2/10) 045 (b) Outpatients Fi
- Page 123 and 124: Sandwell & West Birmingham Hospital
- Page 125 and 126: Risk Register APPENDIX 7 Version 1
- Page 127 and 128: Risk Register APPENDIX 7 Version 1
- Page 129 and 130: Risk Register Impact Narrative Poss
- Page 131 and 132: SWBTB (2/10) 036 ALIGNMENT TO OBJEC
- Page 133 and 134: POLICY PROFILE 2 SWBTB (2/10) 036 (
- Page 135 and 136: Contents page SWBTB (2/10) 036 (a)
- Page 137 and 138: Infection Control Surveillance Nurs
- Page 139 and 140: 5.4.5 Infection Control Surveillanc
- Page 141 and 142: SWBTB (2/10) 036 (a) i) To circulat
- Page 143 and 144: SWBTB (2/10) 036 (a) 6.3.2. Lines o
- Page 145 and 146: 12.0 Monitoring Effectiveness SWBTB
- Page 147 and 148: SWBTB (2/10) 036 (b) Step 2 - Gathe
- Page 149 and 150: SWBTB (2/10) 036 (c) Appendix 5 POL
- Page 151 and 152: SWBTB (2/10) 036 (c) Identify which
- Page 153 and 154: SWBTB (2/10) 037 TRUST BOARD DOCUME
- Page 155 and 156: SWBTB (2/10) 037 (a) 1 Introduction
- Page 157 and 158: SWBTB (2/10) 037 (a) including the
- Page 159 and 160: SWBTB (2/10) 037 (a) • Has the ab
- Page 161 and 162: SWBTB (2/10) 037 (a) either through
- Page 163 and 164: SWBTB (2/10) 037 (a) If a proposed
- Page 165 and 166: SWBTB (2/10) 037 (a) The provision
- Page 167 and 168: SWBTB (2/10) 037 (a) Staff who are
- Page 169 and 170: • Does this decision need to be m
- Page 171 and 172:
SWBTB (2/10) 037 (a) and hence impr
- Page 173 and 174:
SWBTB (2/10) 037 (a) The consultant
- Page 175 and 176:
SWBTB (2/10) 037 (a) Staff undertak
- Page 177 and 178:
SWBTB (2/10) 037 (a) • Procedures
- Page 179 and 180:
SWBTB (2/10) 037 (b) 1 Appendix A 1
- Page 181 and 182:
Appendix A: Consent Form 1 - Right
- Page 183 and 184:
SWBTB (2/10) 037 (b) You should alw
- Page 185 and 186:
Appendix A: Consent Form 2 - Right
- Page 187 and 188:
SWBTB (2/10) 037 (b) appointed guar
- Page 189 and 190:
SWBTB (2/10) 037 (b) Form 3 guidanc
- Page 191 and 192:
Appendix A: Consent Form 4 - Left h
- Page 193 and 194:
SWBTB (2/10) 037 (b) Appendix A: Co
- Page 195 and 196:
SWBTB (2/10) 037 (b) Second opinion
- Page 197 and 198:
SWBTB (2/10) 037 (b) Appendix C San
- Page 199 and 200:
SWBTB (2/10) 037 (b) The young pers
- Page 201 and 202:
SWBTB (2/10) 037 (b) Appendix D Fun
- Page 203 and 204:
SWBTB (2/10) 037 (b) Appendix E How
- Page 205 and 206:
SWBTB (2/10) 037 (b) Appendix G THE
- Page 207 and 208:
SWBTB (2/10) 037 (b) Appendix G3 Tr
- Page 209 and 210:
SWBTB (2/10) 037 (d) Sandwell and W
- Page 211 and 212:
SWBTB (2/10) 037 (d) Introduction T
- Page 213 and 214:
SWBTB (2/10) 037 (d) What are the m
- Page 215 and 216:
SWBTB (2/10) 037 (d) How do I begin
- Page 217 and 218:
Frequently asked Questions SWBTB (2
- Page 219 and 220:
SAPG OCT 09 - 11 - SWBTB (2/10) 037
- Page 221 and 222:
SWBTB (2/10) 037 (d) Q5) Who was in
- Page 223 and 224:
SWBTB (2/10) 037 (d) Appendix B San
- Page 225 and 226:
SWBTB (2/10) 037 (d) 4d The EIA rev
- Page 227 and 228:
SWBTB (2/10) 037 (d) Date: Contact
- Page 230 and 231:
SWBTB (2/10) 037 (e) KEY TASKS ISSU
- Page 232 and 233:
KEY TASKS ISSUES IDENTIFIED ACTION
- Page 234 and 235:
SWBTB (2/10) 029 ALIGNMENT TO OBJEC
- Page 236 and 237:
SWBTB (2/10) 038 ALIGNMENT TO TRUST
- Page 238 and 239:
SWBTB (2/10) 038 (a) From 2010/11 M
- Page 240 and 241:
SWBTB (2/10) 038 (a) Median rate 2.
- Page 242 and 243:
SWBTB (2/10) 038 (a) Audit and Trai
- Page 244 and 245:
SWBTB (2/10) 046 ALIGNMENT TO OBJEC
- Page 246 and 247:
SWBTB (2/10) 046 (a) Compliance Cri
- Page 248 and 249:
3 Provide suitable and sufficient i
- Page 250 and 251:
8 Have and adhere to appropriate po
- Page 252 and 253:
SWBTB (2/10) 027 ALIGNMENT TO OBJEC
- Page 254 and 255:
SWBTB (2/10) 027 (a) PEAT Expendit
- Page 256 and 257:
SWBTB (2/10) 027 (a) A study was co
- Page 258 and 259:
SWBTB (2/10) 039 ALIGNMENT TO OBJEC
- Page 260 and 261:
SWBTB (2/10) 039 (a) Theme Triggers
- Page 262 and 263:
SWBTB (2/10) 029 TRUST BOARD DOCUME
- Page 264 and 265:
SWBTB (2/10) 029 (a) INTRODUCTION S
- Page 266 and 267:
In terms of affordability the follo
- Page 268 and 269:
SMOCS Sandwell PEC HoBt PEC Childre
- Page 270 and 271:
As reported last month, the date fo
- Page 272 and 273:
Les Williams Programme Director 201
- Page 274 and 275:
Respiratory The Project Lead post h
- Page 276 and 277:
SWBTB (2/10) 029 (b) Sandwell and t
- Page 278 and 279:
SWBTB (2/10) 028 ALIGNMENT TO OBJEC
- Page 280 and 281:
With the revised activity / afforda
- Page 282 and 283:
SWBTB (2/10) 041 ALIGNMENT TO OBJEC
- Page 284 and 285:
SWBTB (2/10) 041 (a) • Release 4
- Page 286 and 287:
SWBTB (2/10) 041 (a) • Rotawatch
- Page 288 and 289:
SWBTB (2/10) 030 TRUST BOARD DOCUME
- Page 290 and 291:
SWBGB NEW REF SWBTB (2/10) 030 (a)
- Page 292 and 293:
SWBGB NEW REF SWBTB (2/10) 030 (a)
- Page 294 and 295:
SWBGB NEW REF SWBTB (2/10) 030 (a)
- Page 296 and 297:
SWBGB NEW REF SWBTB (2/10) 030 (a)
- Page 298 and 299:
SWBGB NEW REF SWBTB (2/10) 030 (a)
- Page 300 and 301:
SWBTB (2/10) 031 TRUST BOARD DOCUME
- Page 302 and 303:
SWBTB (2/10) 031 (a) Financial Perf
- Page 304 and 305:
SWBTB (2/10) 031 (a) Financial Perf
- Page 306 and 307:
SWBTB (2/10) 031 (a) Financial Perf
- Page 308 and 309:
SWBTB (2/10) 031 (a) Financial Perf
- Page 310 and 311:
SWBTB (2/10) 031 (a) Financial Perf
- Page 312 and 313:
SWBTB (2/10) 044 TRUST BOARD DOCUME
- Page 314 and 315:
SANDWELL AND WEST BIRMINGHAM HOSPIT
- Page 316 and 317:
Exec Lead RK R0 Readmission Rates I
- Page 318 and 319:
Exec Lead RK RK YTD 09/10 No. 6388
- Page 320 and 321:
SWBTB (2/10) 042 TRUST BOARD DOCUME
- Page 322 and 323:
SWBTB (2/10) 042 (a) SANDWELL AND W
- Page 324 and 325:
SWBTB (2/10) 043 DOCUMENT TITLE: SP
- Page 326 and 327:
SWBTB (2/10) 043 (a) DEVELOPING THE
- Page 328 and 329:
SWBTB (2/10) 043 (a) • Merge the
- Page 330 and 331:
SWBFC (1/10) 010 Finance and Perfor
- Page 332 and 333:
SWBFC (1/10) 010 this be adopted as
- Page 334 and 335:
SWBFC (1/10) 010 The Committee was
- Page 336:
SWBFC (1/10) 010 8.2 Actions and de