Trust Board Febuary 2010 - Sandwell & West Birmingham Hospitals
Trust Board Febuary 2010 - Sandwell & West Birmingham Hospitals
Trust Board Febuary 2010 - Sandwell & West Birmingham Hospitals

Create successful ePaper yourself
Turn your PDF publications into a flip-book with our unique Google optimized e-Paper software.
SWBTB (2/10) 031 (a)<br />
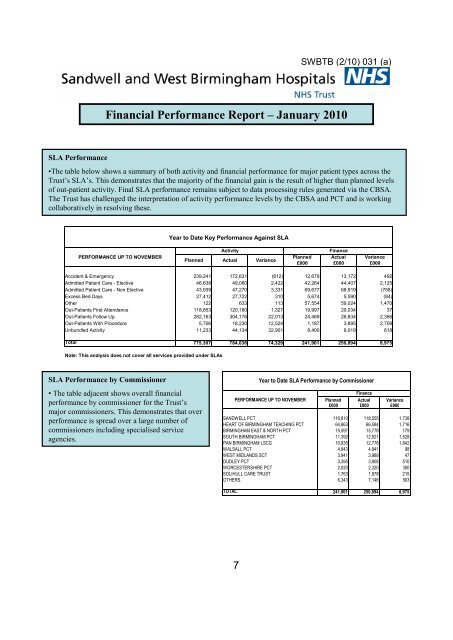
Financial Performance Report – January <strong>2010</strong><br />
SLA Performance<br />
•The table below shows a summary of both activity and financial performance for major patient types across the<br />
<strong>Trust</strong>’s SLA’s. This demonstrates that the majority of the financial gain is the result of higher than planned levels<br />
of out-patient activity. Final SLA performance remains subject to data processing rules generated via the CBSA.<br />
The <strong>Trust</strong> has challenged the interpretation of activity performance levels by the CBSA and PCT and is working<br />
collaboratively in resolving these.<br />
Year to Date Key Performance Against SLA<br />
Activity<br />
Finance<br />
PERFORMANCE UP TO NOVEMBER Planned Actual Variance<br />
Planned Actual Variance<br />
£000 £000 £000<br />
Accident & Emergency 239,241 172,631 (612) 12,679 13,172 492<br />
Admitted Patient Care - Elective 46,638 49,060 2,422 42,264 44,407 2,125<br />
Admitted Patient Care - Non Elective 43,939 47,270 3,331 69,677 68,919 (758)<br />
Excess Bed Days 27,412 27,722 310 5,674 5,590 (84)<br />
Other 122 633 113 57,554 59,024 1,470<br />
Out-Patients First Attendance 118,853 120,180 1,327 19,997 20,034 37<br />
Out-Patients Follow Up 282,163 304,176 22,013 24,469 26,834 2,366<br />
Out-Patients With Procedure 5,706 18,230 12,524 1,187 3,895 2,709<br />
Unbundled Activity 11,233 44,134 32,901 8,400 9,019 618<br />
Total 775,307 784,036 74,329 241,901 250,894 8,975<br />
Note: This analysis does not cover all services provided under SLAs<br />
SLA Performance by Commissioner<br />
• The table adjacent shows overall financial<br />
performance by commissioner for the <strong>Trust</strong>’s<br />
major commissioners. This demonstrates that over<br />
performance is spread over a large number of<br />
commissioners including specialised service<br />
agencies.<br />
Year to Date SLA Performance by Commissioner<br />
Finance<br />
PERFORMANCE UP TO NOVEMBER Planned Actual Variance<br />
£000 £000 £000<br />
SANDWELL PCT 116,810 118,555 1,738<br />
HEART OF BIRMINGHAM TEACHING PCT 64,863 66,584 1,716<br />
BIRMINGHAM EAST & NORTH PCT 15,597 15,778 179<br />
SOUTH BIRMINGHAM PCT 11,392 12,921 1,528<br />
PAN BIRMINGHAM LSCG 10,935 12,776 1,842<br />
WALSALL PCT 4,843 4,941 98<br />
WEST MIDLANDS SCT 3,941 3,988 47<br />
DUDLEY PCT 3,395 3,908 510<br />
WORCESTERSHIRE PCT 2,020 2,320 300<br />
SOLIHULL CARE TRUST 1,763 1,978 215<br />
OTHERS 6,343 7,146 803<br />
TOTAL 241,901 250,894 8,975<br />
7