SWBTB (2/10) 031 (a) Financial Performance Report – January <strong>2010</strong> Analysis of Total Pay Costs by Staff Group Year to Date to January Actual Budget Substantive Bank Agency Total Variance £000 £000 £000 £000 £000 £000 Medical Staffing 61,135 61,181 1,779 62,960 -1,825 Management 11,386 10,668 0 10,668 718 Administration & Estates 23,378 22,721 979 23,700 -322 Healthcare Assistants & Support Staff 10,225 10,070 1,635 1,022 12,727 -2,502 Nursing and Midwifery 72,496 67,595 3,575 914 72,084 412 Scientific, Therapeutic & Technical 28,013 27,295 147 27,442 571 Other Pay 43 15 15 28 Total Pay Costs 206,676 199,545 5,210 4,841 209,596 -2,920 Balance Sheet • The opening Statement of Financial Position (balance sheet) for the year at 1 st April reflects the IFRS based audited accounts for 2008/2009. • Cash balances at 31 st January are approximately £1.8m higher than the revised plan, an increase of approximately £0.5m against the position at 31 st December The <strong>Trust</strong> has now received confirmation of its final External Financing limit for 31 st March <strong>2010</strong> which is -£568k i.e. a net repayment of PDC. To achieve this target, the <strong>Trust</strong>’s cash balance at the year end will need to be £8,852k. The year end cash forecast and the revised plan have been amended to reflect this figure. Although other updates have been made to the forecast movements, no further changes have been made to the revised plan as the overall effect of the changes is not material. <strong>Sandwell</strong> & <strong>West</strong> <strong>Birmingham</strong> <strong>Hospitals</strong> NHS <strong>Trust</strong> STATEMENT OF FINANCIAL POSITION Opening Balance as at March 2009 Balance as at January <strong>2010</strong> £000 £000 £000 Forecast at March <strong>2010</strong> Non Current Assets Intangible Assets 547 460 522 Tangible Assets 277,912 272,052 257,371 Investments 0 0 0 Receivables 1,158 1,140 1,200 Current Assets Inventories 3,295 3,276 3,300 Receivables and Accrued Income 19,138 23,547 19,500 Investments 0 0 0 Cash 8,752 23,719 8,852 Current Liabilities Payables and Accrued Expenditure (28,516) (44,575) (32,806) Loans 0 0 0 Borrowings (1,885) (1,880) (1,880) Provisions (5,440) (2,059) (2,200) Non Current Liabilities Payables and Accrued Expenditure 0 0 0 Loans 0 0 0 Borrowings (33,627) (32,227) (31,127) Provisions (2,193) (2,193) (1,943) Financed By 239,141 241,260 220,789 Taxpayers Equity Public Dividend Capital 160,231 160,231 159,663 Revaluation Reserve 60,699 60,699 40,966 Donated Asset Reserve 2,531 2,531 2,391 Government Grant Reserve 1,985 1,985 1,805 Other Reserves 9,058 9,058 9,058 Income and Expenditure Reserve 4,637 6,756 6,906 239,141 241,260 220,789 5
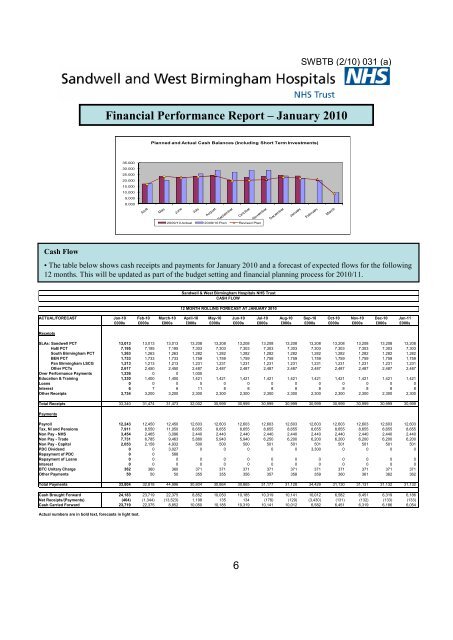
SWBTB (2/10) 031 (a) Financial Performance Report – January <strong>2010</strong> Planned and Actual Cash Balances (Including Short Term Investments) 35.000 30.000 25.000 20.000 15.000 10.000 5.000 0.000 2009/10 Actual 2009/10 Plan Revised Plan Cash Flow • The table below shows cash receipts and payments for January <strong>2010</strong> and a forecast of expected flows for the following 12 months. This will be updated as part of the budget setting and financial planning process for <strong>2010</strong>/11. <strong>Sandwell</strong> & <strong>West</strong> <strong>Birmingham</strong> <strong>Hospitals</strong> NHS <strong>Trust</strong> CASH FLOW 12 MONTH ROLLING FORECAST AT JANUARY <strong>2010</strong> ACTUAL/FORECAST Jan-10 Feb-10 March-10 April-10 May-10 Jun-10 Jul-10 Aug-10 Sep-10 Oct-10 Nov-10 Dec-10 Jan-11 £000s £000s £000s £000s £000s £000s £000s £000s £000s £000s £000s £000s £000s Receipts SLAs: <strong>Sandwell</strong> PCT 13,013 13,013 13,013 13,208 13,208 13,208 13,208 13,208 13,208 13,208 13,208 13,208 13,208 HoB PCT 7,195 7,195 7,195 7,303 7,303 7,303 7,303 7,303 7,303 7,303 7,303 7,303 7,303 South <strong>Birmingham</strong> PCT 1,263 1,263 1,263 1,282 1,282 1,282 1,282 1,282 1,282 1,282 1,282 1,282 1,282 BEN PCT 1,733 1,733 1,733 1,759 1,759 1,759 1,759 1,759 1,759 1,759 1,759 1,759 1,759 Pan <strong>Birmingham</strong> LSCG 1,213 1,213 1,213 1,231 1,231 1,231 1,231 1,231 1,231 1,231 1,231 1,231 1,231 Other PCTs 2,617 2,450 2,450 2,487 2,487 2,487 2,487 2,487 2,487 2,487 2,487 2,487 2,487 Over Performance Payments 1,236 0 0 1,000 Education & Training 1,330 1,400 1,400 1,421 1,421 1,421 1,421 1,421 1,421 1,421 1,421 1,421 1,421 Loans 0 0 0 0 0 0 0 0 0 0 0 0 0 Interest 6 7 6 11 8 8 8 8 8 8 8 8 8 Other Receipts 3,734 3,200 3,200 2,300 2,300 2,300 2,300 2,300 2,300 2,300 2,300 2,300 2,300 Total Receipts 33,340 31,474 31,473 32,002 30,999 30,999 30,999 30,999 30,999 30,999 30,999 30,999 30,999 Payments Payroll 12,243 12,450 12,450 12,603 12,603 12,603 12,603 12,603 12,603 12,603 12,603 12,603 12,603 Tax, NI and Pensions 7,911 8,550 11,050 8,655 8,655 8,655 8,655 8,655 8,655 8,655 8,655 8,655 8,655 Non Pay - NHS 3,454 2,465 3,096 2,440 2,440 2,440 2,440 2,440 2,440 2,440 2,440 2,440 2,440 Non Pay - Trade 7,731 6,785 9,463 5,880 5,940 5,940 6,250 6,200 6,200 6,200 6,200 6,200 6,200 Non Pay - Capital 2,053 2,158 4,932 500 500 500 501 501 501 501 501 501 501 PDC Dividend 0 0 3,027 0 0 0 0 0 3,300 0 0 0 0 Repayment of PDC 0 0 568 Repayment of Loans 0 0 0 0 0 0 0 0 0 0 0 0 0 Interest 0 0 0 0 0 0 0 0 0 0 0 0 0 BTC Unitary Charge 362 360 360 371 371 371 371 371 371 371 371 371 371 Other Payments 50 50 50 355 355 356 357 358 359 360 361 362 362 Total Payments 33,804 32,818 44,996 30,804 30,864 30,865 31,177 31,128 34,429 31,130 31,131 31,132 31,132 Cash Brought Forward 24,183 23,719 22,375 8,852 10,050 10,185 10,319 10,141 10,012 6,582 6,451 6,319 6,186 Net Receipts/(Payments) (464) (1,344) (13,523) 1,198 135 134 (178) (129) (3,430) (131) (132) (133) (133) Cash Carried Forward 23,719 22,375 8,852 10,050 10,185 10,319 10,141 10,012 6,582 6,451 6,319 6,186 6,054 Actual numbers are in bold text, forecasts in light text. 6
- Page 1 and 2:
SWBTB (2/10) 026 AGENDA Trust Board
- Page 3 and 4:
SWBTB (2/10) 026 18 Any other busin
- Page 5 and 6:
MINUTES approved as true and accura
- Page 7 and 8:
MINUTES expectation that there woul
- Page 9 and 10:
MINUTES however the structure would
- Page 11 and 12:
MINUTES which was reported to be un
- Page 13 and 14:
MINUTES Mr Cash asked which communi
- Page 15 and 16:
MINUTES Mr Seager presented an upda
- Page 17 and 18:
SWBTB (2/10) 025 (a) Next Meeting:
- Page 19 and 20:
SWBTB (2/10) 035 TRUST BOARD DOCUME
- Page 21 and 22:
SWBTB (2/10) 035 PREVIOUS CONSIDERA
- Page 23 and 24:
SWBTB (2/10) 035 (a) Contents Page
- Page 25 and 26:
SWBTB (2/10) 035 (a) 2. Methodology
- Page 27 and 28:
SWBTB (2/10) 035 (a) 2.3 Reach 780
- Page 29 and 30:
SWBTB (2/10) 035 (a) 7
- Page 31 and 32:
SWBTB (2/10) 035 (a) 3. Option Pref
- Page 33 and 34:
SWBTB (2/10) 035 (a) Table 3 Comple
- Page 35 and 36:
SWBTB (2/10) 035 (a) • A number o
- Page 37 and 38:
SWBTB (2/10) 035 (a) • Satisfied
- Page 39 and 40:
SWBTB (2/10) 035 (a) • Bad experi
- Page 41 and 42:
SWBTB (2/10) 035 (a) Table 5 Focus
- Page 43 and 44:
SWBTB (2/10) 035 (a) Some women kne
- Page 45 and 46:
SWBTB (2/10) 035 (a) • Reputation
- Page 47 and 48:
SWBTB (2/10) 035 (a) Young people p
- Page 49 and 50:
SWBTB (2/10) 035 (a) Table 7 Showin
- Page 51 and 52:
SWBTB (2/10) 035 (a) home birth wou
- Page 53 and 54:
SWBTB (2/10) 035 (a) Black Caribbea
- Page 55 and 56:
SWBTB (2/10) 035 (a) White and Blac
- Page 57 and 58:
SWBTB (2/10) 035 (a) • Labour Par
- Page 59 and 60:
SWBTB (2/10) 035 (a) Role Number of
- Page 61 and 62:
SWBTB (2/10) 035 (a) Appendix 1 Foc
- Page 63 and 64:
SWBTB (2/10) 035 (a) Appendix 2 Pro
- Page 65 and 66:
SWBTB (2/10) 035 (a) Postcode Area
- Page 67 and 68:
SWBTB (2/10) 035 (a) Chart 2: Women
- Page 69 and 70:
SWBTB (2/10) 035 (a) Chart 6: Women
- Page 71 and 72:
SWBTB (2/10) 035 (a) Chart 10: Wome
- Page 73 and 74:
SWBTB (2/10) 035 (a) Appendix 5 Com
- Page 75 and 76:
SWBTB (2/10) 035 (a) Appendix 7 Bir
- Page 77 and 78:
SWBTB (2/10) 045 TRUST BOARD DOCUME
- Page 79 and 80:
SWBTB (2/10) 045 IMPACT ASSESSMENT
- Page 81 and 82:
SWBTB (2/10) 045 (a) MATERNITY SERV
- Page 83 and 84:
SWBTB (2/10) 045 (a) All consultant
- Page 85 and 86:
SWBTB (2/10) 045 (a) • APPROVE th
- Page 87 and 88:
SWBTB (2/10) 045 (a) strategy the S
- Page 89 and 90:
SWBTB (2/10) 045 (a) These efforts
- Page 91 and 92:
SWBTB (2/10) 045 (a) risk women in
- Page 93 and 94:
SWBTB (2/10) 045 (a) • Shorter la
- Page 95 and 96:
SWBTB (2/10) 045 (a) Benefit Descri
- Page 97 and 98:
SWBTB (2/10) 045 (a) From the compl
- Page 99 and 100:
SWBTB (2/10) 045 (a) Concerns about
- Page 101 and 102:
SWBTB (2/10) 045 (a) Stages 5 - 9:
- Page 103 and 104:
SWBTB (2/10) 045 (a) The scheme dur
- Page 105 and 106:
SWBTB (2/10) 045 (a) • The stand
- Page 107 and 108:
SWBTB (2/10) 045 (a) 10. INVESTMENT
- Page 109 and 110:
SWBTB (2/10) 045 (a) 11.2 Activity
- Page 111 and 112:
SWBTB (2/10) 045 (a) 13. CASHFLOW P
- Page 113 and 114:
SWBTB (2/10) 045 (a) 15. JOINT HEAL
- Page 115 and 116:
SWBTB (2/10) 045 (a) Sandwell PCT w
- Page 117 and 118:
SWBTB (2/10) 045 (a) APPENDIX 7 DOC
- Page 119 and 120:
SWBTB (2/10) 045 (b) Outpatients Fi
- Page 121 and 122:
SWBTB (2/10) 045 (b) Sandwell & Wes
- Page 123 and 124:
Sandwell & West Birmingham Hospital
- Page 125 and 126:
Risk Register APPENDIX 7 Version 1
- Page 127 and 128:
Risk Register APPENDIX 7 Version 1
- Page 129 and 130:
Risk Register Impact Narrative Poss
- Page 131 and 132:
SWBTB (2/10) 036 ALIGNMENT TO OBJEC
- Page 133 and 134:
POLICY PROFILE 2 SWBTB (2/10) 036 (
- Page 135 and 136:
Contents page SWBTB (2/10) 036 (a)
- Page 137 and 138:
Infection Control Surveillance Nurs
- Page 139 and 140:
5.4.5 Infection Control Surveillanc
- Page 141 and 142:
SWBTB (2/10) 036 (a) i) To circulat
- Page 143 and 144:
SWBTB (2/10) 036 (a) 6.3.2. Lines o
- Page 145 and 146:
12.0 Monitoring Effectiveness SWBTB
- Page 147 and 148:
SWBTB (2/10) 036 (b) Step 2 - Gathe
- Page 149 and 150:
SWBTB (2/10) 036 (c) Appendix 5 POL
- Page 151 and 152:
SWBTB (2/10) 036 (c) Identify which
- Page 153 and 154:
SWBTB (2/10) 037 TRUST BOARD DOCUME
- Page 155 and 156:
SWBTB (2/10) 037 (a) 1 Introduction
- Page 157 and 158:
SWBTB (2/10) 037 (a) including the
- Page 159 and 160:
SWBTB (2/10) 037 (a) • Has the ab
- Page 161 and 162:
SWBTB (2/10) 037 (a) either through
- Page 163 and 164:
SWBTB (2/10) 037 (a) If a proposed
- Page 165 and 166:
SWBTB (2/10) 037 (a) The provision
- Page 167 and 168:
SWBTB (2/10) 037 (a) Staff who are
- Page 169 and 170:
• Does this decision need to be m
- Page 171 and 172:
SWBTB (2/10) 037 (a) and hence impr
- Page 173 and 174:
SWBTB (2/10) 037 (a) The consultant
- Page 175 and 176:
SWBTB (2/10) 037 (a) Staff undertak
- Page 177 and 178:
SWBTB (2/10) 037 (a) • Procedures
- Page 179 and 180:
SWBTB (2/10) 037 (b) 1 Appendix A 1
- Page 181 and 182:
Appendix A: Consent Form 1 - Right
- Page 183 and 184:
SWBTB (2/10) 037 (b) You should alw
- Page 185 and 186:
Appendix A: Consent Form 2 - Right
- Page 187 and 188:
SWBTB (2/10) 037 (b) appointed guar
- Page 189 and 190:
SWBTB (2/10) 037 (b) Form 3 guidanc
- Page 191 and 192:
Appendix A: Consent Form 4 - Left h
- Page 193 and 194:
SWBTB (2/10) 037 (b) Appendix A: Co
- Page 195 and 196:
SWBTB (2/10) 037 (b) Second opinion
- Page 197 and 198:
SWBTB (2/10) 037 (b) Appendix C San
- Page 199 and 200:
SWBTB (2/10) 037 (b) The young pers
- Page 201 and 202:
SWBTB (2/10) 037 (b) Appendix D Fun
- Page 203 and 204:
SWBTB (2/10) 037 (b) Appendix E How
- Page 205 and 206:
SWBTB (2/10) 037 (b) Appendix G THE
- Page 207 and 208:
SWBTB (2/10) 037 (b) Appendix G3 Tr
- Page 209 and 210:
SWBTB (2/10) 037 (d) Sandwell and W
- Page 211 and 212:
SWBTB (2/10) 037 (d) Introduction T
- Page 213 and 214:
SWBTB (2/10) 037 (d) What are the m
- Page 215 and 216:
SWBTB (2/10) 037 (d) How do I begin
- Page 217 and 218:
Frequently asked Questions SWBTB (2
- Page 219 and 220:
SAPG OCT 09 - 11 - SWBTB (2/10) 037
- Page 221 and 222:
SWBTB (2/10) 037 (d) Q5) Who was in
- Page 223 and 224:
SWBTB (2/10) 037 (d) Appendix B San
- Page 225 and 226:
SWBTB (2/10) 037 (d) 4d The EIA rev
- Page 227 and 228:
SWBTB (2/10) 037 (d) Date: Contact
- Page 230 and 231:
SWBTB (2/10) 037 (e) KEY TASKS ISSU
- Page 232 and 233:
KEY TASKS ISSUES IDENTIFIED ACTION
- Page 234 and 235:
SWBTB (2/10) 029 ALIGNMENT TO OBJEC
- Page 236 and 237:
SWBTB (2/10) 038 ALIGNMENT TO TRUST
- Page 238 and 239:
SWBTB (2/10) 038 (a) From 2010/11 M
- Page 240 and 241:
SWBTB (2/10) 038 (a) Median rate 2.
- Page 242 and 243:
SWBTB (2/10) 038 (a) Audit and Trai
- Page 244 and 245:
SWBTB (2/10) 046 ALIGNMENT TO OBJEC
- Page 246 and 247:
SWBTB (2/10) 046 (a) Compliance Cri
- Page 248 and 249:
3 Provide suitable and sufficient i
- Page 250 and 251:
8 Have and adhere to appropriate po
- Page 252 and 253:
SWBTB (2/10) 027 ALIGNMENT TO OBJEC
- Page 254 and 255:
SWBTB (2/10) 027 (a) PEAT Expendit
- Page 256 and 257: SWBTB (2/10) 027 (a) A study was co
- Page 258 and 259: SWBTB (2/10) 039 ALIGNMENT TO OBJEC
- Page 260 and 261: SWBTB (2/10) 039 (a) Theme Triggers
- Page 262 and 263: SWBTB (2/10) 029 TRUST BOARD DOCUME
- Page 264 and 265: SWBTB (2/10) 029 (a) INTRODUCTION S
- Page 266 and 267: In terms of affordability the follo
- Page 268 and 269: SMOCS Sandwell PEC HoBt PEC Childre
- Page 270 and 271: As reported last month, the date fo
- Page 272 and 273: Les Williams Programme Director 201
- Page 274 and 275: Respiratory The Project Lead post h
- Page 276 and 277: SWBTB (2/10) 029 (b) Sandwell and t
- Page 278 and 279: SWBTB (2/10) 028 ALIGNMENT TO OBJEC
- Page 280 and 281: With the revised activity / afforda
- Page 282 and 283: SWBTB (2/10) 041 ALIGNMENT TO OBJEC
- Page 284 and 285: SWBTB (2/10) 041 (a) • Release 4
- Page 286 and 287: SWBTB (2/10) 041 (a) • Rotawatch
- Page 288 and 289: SWBTB (2/10) 030 TRUST BOARD DOCUME
- Page 290 and 291: SWBGB NEW REF SWBTB (2/10) 030 (a)
- Page 292 and 293: SWBGB NEW REF SWBTB (2/10) 030 (a)
- Page 294 and 295: SWBGB NEW REF SWBTB (2/10) 030 (a)
- Page 296 and 297: SWBGB NEW REF SWBTB (2/10) 030 (a)
- Page 298 and 299: SWBGB NEW REF SWBTB (2/10) 030 (a)
- Page 300 and 301: SWBTB (2/10) 031 TRUST BOARD DOCUME
- Page 302 and 303: SWBTB (2/10) 031 (a) Financial Perf
- Page 304 and 305: SWBTB (2/10) 031 (a) Financial Perf
- Page 308 and 309: SWBTB (2/10) 031 (a) Financial Perf
- Page 310 and 311: SWBTB (2/10) 031 (a) Financial Perf
- Page 312 and 313: SWBTB (2/10) 044 TRUST BOARD DOCUME
- Page 314 and 315: SANDWELL AND WEST BIRMINGHAM HOSPIT
- Page 316 and 317: Exec Lead RK R0 Readmission Rates I
- Page 318 and 319: Exec Lead RK RK YTD 09/10 No. 6388
- Page 320 and 321: SWBTB (2/10) 042 TRUST BOARD DOCUME
- Page 322 and 323: SWBTB (2/10) 042 (a) SANDWELL AND W
- Page 324 and 325: SWBTB (2/10) 043 DOCUMENT TITLE: SP
- Page 326 and 327: SWBTB (2/10) 043 (a) DEVELOPING THE
- Page 328 and 329: SWBTB (2/10) 043 (a) • Merge the
- Page 330 and 331: SWBFC (1/10) 010 Finance and Perfor
- Page 332 and 333: SWBFC (1/10) 010 this be adopted as
- Page 334 and 335: SWBFC (1/10) 010 The Committee was
- Page 336: SWBFC (1/10) 010 8.2 Actions and de