Trust Board Febuary 2010 - Sandwell & West Birmingham Hospitals
Trust Board Febuary 2010 - Sandwell & West Birmingham Hospitals
Trust Board Febuary 2010 - Sandwell & West Birmingham Hospitals

Create successful ePaper yourself
Turn your PDF publications into a flip-book with our unique Google optimized e-Paper software.
SWBTB (2/10) 031 (a)<br />
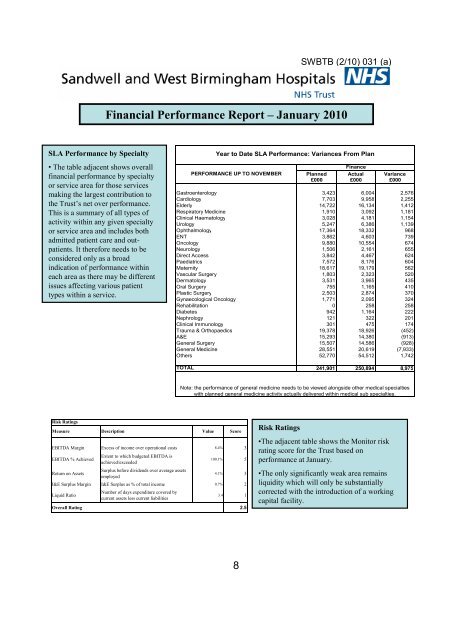
Financial Performance Report – January <strong>2010</strong><br />
SLA Performance by Specialty<br />
• The table adjacent shows overall<br />
financial performance by specialty<br />
or service area for those services<br />
making the largest contribution to<br />
the <strong>Trust</strong>’s net over performance.<br />
This is a summary of all types of<br />
activity within any given specialty<br />
or service area and includes both<br />
admitted patient care and outpatients.<br />
It therefore needs to be<br />
considered only as a broad<br />
indication of performance within<br />
each area as there may be different<br />
issues affecting various patient<br />
types within a service.<br />
Year to Date SLA Performance: Variances From Plan<br />
Finance<br />
PERFORMANCE UP TO NOVEMBER Planned Actual Variance<br />
£000 £000 £000<br />
Gastroenterology 3,423 6,004 2,576<br />
Cardiology 7,703 9,958 2,255<br />
Elderly 14,722 16,134 1,412<br />
Respiratory Medicine 1,910 3,092 1,181<br />
Clinical Haematology 3,028 4,181 1,154<br />
Urology 5,247 6,386 1,139<br />
Ophthalmology 17,364 18,332 968<br />
ENT 3,862 4,603 739<br />
Oncology 9,880 10,554 674<br />
Neurology 1,506 2,161 655<br />
Direct Access 3,842 4,467 624<br />
Paediatrics 7,572 8,176 604<br />
Maternity 18,617 19,179 562<br />
Vascular Surgery 1,803 2,323 520<br />
Dermatology 3,531 3,965 435<br />
Oral Surgery 755 1,165 410<br />
Plastic Surgery 2,503 2,874 370<br />
Gynaecological Oncology 1,771 2,095 324<br />
Rehabilitation 0 258 258<br />
Diabetes 942 1,164 222<br />
Nephrology 121 322 201<br />
Clinical Immunology 301 475 174<br />
Trauma & Orthopaedics 19,378 18,926 (452)<br />
A&E 15,293 14,380 (913)<br />
General Surgery 15,507 14,586 (928)<br />
General Medicine 28,551 20,619 (7,933)<br />
Others 52,770 54,512 1,742<br />
TOTAL 241,901 250,894 8,975<br />
Note: the performance of general medicine needs to be viewed alongside other medical specialties<br />
with planned general medicine activity actually delivered within medical sub specialties.<br />
Risk Ratings<br />
Measure Description Value Score<br />
EBITDA Margin Excess of income over operational costs 8.4% 3<br />
EBITDA % Achieved<br />
Return on Assets<br />
Extent to which budgeted EBITDA is<br />
achieved/exceeded<br />
Surplus before dividends over average assets<br />
employed<br />
100.1% 5<br />
4.1% 3<br />
I&E Surplus Margin I&E Surplus as % of total income 0.7% 2<br />
Liquid Ratio<br />
Number of days expenditure covered by<br />
current assets less current liabilities<br />
3.4 1<br />
Overall Rating 2.5<br />
Risk Ratings<br />
•The adjacent table shows the Monitor risk<br />
rating score for the <strong>Trust</strong> based on<br />
performance at January.<br />
•The only significantly weak area remains<br />
liquidity which will only be substantially<br />
corrected with the introduction of a working<br />
capital facility.<br />
8