Trust Board Febuary 2010 - Sandwell & West Birmingham Hospitals
Trust Board Febuary 2010 - Sandwell & West Birmingham Hospitals
Trust Board Febuary 2010 - Sandwell & West Birmingham Hospitals

Create successful ePaper yourself
Turn your PDF publications into a flip-book with our unique Google optimized e-Paper software.
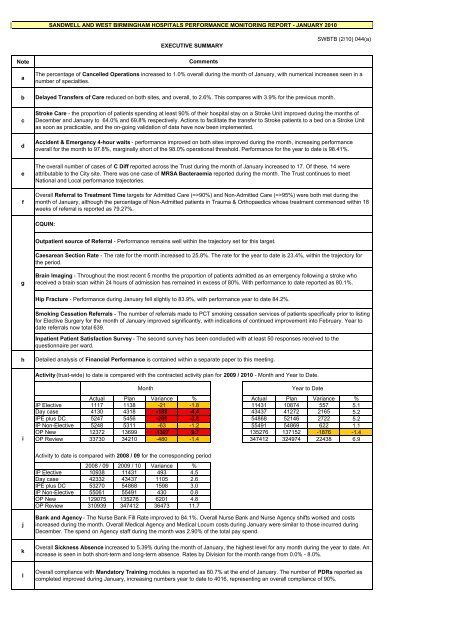
SANDWELL AND WEST BIRMINGHAM HOSPITALS PERFORMANCE MONITORING REPORT - JANUARY <strong>2010</strong><br />
EXECUTIVE SUMMARY<br />
SWBTB (2/10) 044(a)<br />
Note<br />
a<br />
b<br />
Comments<br />
The percentage of Cancelled Operations increased to 1.0% overall during the month of January, with numerical increases seen in a<br />
number of specialties.<br />
Delayed Transfers of Care reduced on both sites, and overall, to 2.6%. This compares with 3.9% for the previous month.<br />
c<br />
d<br />
Stroke Care - the proportion of patients spending at least 90% of their hospital stay on a Stroke Unit improved during the months of<br />
December and January to 64.0% and 69.8% respectively. Actions to facilitate the transfer to Stroke patients to a bed on a Stroke Unit<br />
as soon as practicable, and the on-going validation of data have now been implemented.<br />
Accident & Emergency 4-hour waits - performance improved on both sites improved during the month, increasing performance<br />
overall for the month to 97.8%, marginally short of the 98.0% operational threshold. Performance for the year to date is 98.41%.<br />
e<br />
f<br />
The overall number of cases of C Diff reported across the <strong>Trust</strong> during the month of January increased to 17. Of these, 14 were<br />
attributable to the City site. There was one case of MRSA Bacteraemia reported during the month. The <strong>Trust</strong> continues to meet<br />
National and Local performance trajectories.<br />
Overall Referral to Treatment Time targets for Admitted Care (=>90%) and Non-Admitted Care (=>95%) were both met during the<br />
month of January, although the percentage of Non-Admitted patients in Trauma & Orthopaedics whose treatment commenced within 18<br />
weeks of referral is reported as 79.27%.<br />
CQUIN:<br />
Outpatient source of Referral - Performance remains well within the trajectory set for this target.<br />
Caesarean Section Rate - The rate for the month increased to 25.8%. The rate for the year to date is 23.4%, within the trajectory for<br />
the period.<br />
g<br />
Brain Imaging - Throughout the most recent 5 months the proportion of patients admitted as an emergency following a stroke who<br />
received a brain scan within 24 hours of admission has remained in excess of 80%. With performance to date reported as 80.1%.<br />
Hip Fracture - Performance during January fell slightly to 83.9%, with performance year to date 84.2%.<br />
Smoking Cessation Referrals - The number of referrals made to PCT smoking cessation services of patients specifically prior to listing<br />
for Elective Surgery for the month of January improved significantly, with indications of continued improvement into February. Year to<br />
date referrals now total 639.<br />
Inpatient Patient Satisfaction Survey - The second survey has been concluded with at least 50 responses received to the<br />
questionnaire per ward.<br />
h<br />
Detailed analysis of Financial Performance is contained within a separate paper to this meeting.<br />
Activity (trust-wide) to date is compared with the contracted activity plan for 2009 / <strong>2010</strong> - Month and Year to Date.<br />
i<br />
Month<br />
Year to Date<br />
Actual Plan Variance % Actual Plan Variance %<br />
IP Elective 1117 1138 -21 -1.8 11431 10874 557 5.1<br />
Day case 4130 4318 -188 -4.4 43437 41272 2165 5.2<br />
IPE plus DC 5247 5456 -209 -3.8 54868 52146 2722 5.2<br />
IP Non-Elective 5248 5311 -63 -1.2 55491 54869 622 1.1<br />
OP New 12372 13699 -1327 -9.7 135276 137152 -1876 -1.4<br />
OP Review 33730 34210 -480 -1.4 347412 324974 22438 6.9<br />
Activity to date is compared with 2008 / 09 for the corresponding period<br />
2008 / 09 2009 / 10 Variance %<br />
IP Elective 10938 11431 493 4.5<br />
Day case 42332 43437 1105 2.6<br />
IPE plus DC 53270 54868 1598 3.0<br />
IP Non-Elective 55061 55491 430 0.8<br />
OP New 129075 135276 6201 4.8<br />
OP Review 310939 347412 36473 11.7<br />
j<br />
Bank and Agency - The Nurse Bank Fill Rate improved to 84.1%. Overall Nurse Bank and Nurse Agency shifts worked and costs<br />
increased during the month. Overall Medical Agency and Medical Locum costs during January were similar to those incurred during<br />
December. The spend on Agency staff during the month was 2.90% of the total pay spend.<br />
k<br />
Overall Sickness Absence increased to 5.39% during the month of January, the highest level for any month during the year to date. An<br />
increase is seen in both short-term and long-term absence. Rates by Division for the month range from 0.0% - 8.0%.<br />
l<br />
Overall compliance with Mandatory Training modules is reported as 60.7% at the end of January. The number of PDRs reported as<br />
completed improved during January, increasing numbers year to date to 4016, representing an overall compliance of 90%.