- Page 1: World Small Hydropower Development
- Page 5 and 6: Published in 2013 by United Nations
- Page 7 and 8: in the World Small Hydropower Devel
- Page 9 and 10: Acknowledgements The World Small Hy
- Page 11 and 12: JICA NEP NREAP OLADE PICTS PPA PPP
- Page 13 and 14: 86 1.3.3 Morocco 90 1.3.4 Sudan 92
- Page 15 and 16: 301 3.5.3 Georgia 304 3.5.4 Iraq 30
- Page 17 and 18: Executive Summary Comprehensive inf
- Page 19 and 20: electrification, building micro-hyd
- Page 21 and 22: potential is Chile (7,000 MW). Some
- Page 23 and 24: A range of barriers exist in Southe
- Page 25 and 26: The Renewable Energy Directive has
- Page 27 and 28: The WSHPDR 2013 proposes a more det
- Page 29 and 30: Introduction A world-first assessme
- Page 31 and 32: Small hydropower definition Countri
- Page 33 and 34: 12. United Nations Environment Prog
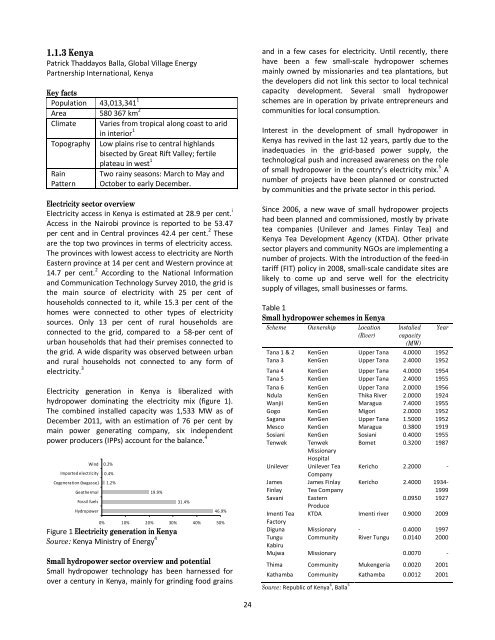
- Page 35 and 36: small- and micro-hydro plants in ru
- Page 37 and 38: 1.1.2 Ethiopia Lara Esser, Internat
- Page 39: potential developers, since their p
- Page 43 and 44: Financial institutions are not will
- Page 45 and 46: Table 1 Installed small hydropower
- Page 47 and 48: 10. Électricité de Madagascar (20
- Page 49 and 50: the district of Mulanje. The Agency
- Page 51 and 52: 1.1.6 Mauritius Lara Esser, Interna
- Page 53 and 54: 1.1.7 Mozambique Wim Jonker Klunne,
- Page 55 and 56: with local entrepreneurs to extend
- Page 57 and 58: 1.1.8 Réunion Lara Esser and Laxmi
- Page 59 and 60: 1.1.9 Rwanda Lara Esser and Laxmi A
- Page 61 and 62: Different donor agencies have assis
- Page 63 and 64: 1.1.10 South Sudan Ater Amogpai, Un
- Page 65 and 66: 5. Al Jazeera (2012). China offers
- Page 67 and 68: Table 1 Installed small hydropower
- Page 69 and 70: newsletter-issue-5/. 8. Tumwesigye,
- Page 71 and 72: 70% 60% 50% 40% 30% 20% 10% 0% 2% 1
- Page 73 and 74: Table 2 Potential small hydropower
- Page 75 and 76: 1.1.13 Zambia Malama Chileshe, Zamb
- Page 77 and 78: the challenge remains as to whether
- Page 79 and 80: Francis turbine. Project commission
- Page 81 and 82: 1.2 Middle Africa Matty Fombong, Ru
- Page 83 and 84: 1.2.1 Angola Lara Esser, Internatio
- Page 85 and 86: out according to social, economic a
- Page 87 and 88: avaged by vandals for parts and cop
- Page 89 and 90: 1.2.3 Central African Republic Lara
- Page 91 and 92:
1.2.4 Democratic Republic of the Co
- Page 93 and 94:
1.2.5 São Tomé and Príncipe Lara
- Page 95 and 96:
1.3 Northern Africa Hussein Elhag,
- Page 97 and 98:
1.3.1 Algeria Kai Whiting, Internat
- Page 99 and 100:
1.3.2 Egypt Kai Whiting and Pascal
- Page 101 and 102:
Barriers to small hydropower develo
- Page 103 and 104:
SHP installed capacity (up to 8 MW)
- Page 105 and 106:
16. Agence Nationale pour le Dével
- Page 107 and 108:
construction and the project will b
- Page 109 and 110:
Table 1 Small hydropower in Tunisia
- Page 111 and 112:
1.4 Southern Africa Wim Jonker Klun
- Page 113 and 114:
1.4.1 Lesotho Wim Jonker Klunne, Co
- Page 115 and 116:
and the penstock is a 150-metre lon
- Page 117 and 118:
oth present and future”. Should t
- Page 119 and 120:
1.4.3 South Africa Wim Jonker Klunn
- Page 121 and 122:
hydropower in South Africa and the
- Page 123 and 124:
Integrated resource plan for electr
- Page 125 and 126:
Figure 3 Map of potential hydropowe
- Page 127 and 128:
1.5 Western Africa A. A. Esan, UNID
- Page 129 and 130:
Trust funds for renewable energy te
- Page 131 and 132:
According to a 2010 analysis for in
- Page 133 and 134:
consumption, as well as cost deprec
- Page 135 and 136:
Sustainable energy through developi
- Page 137 and 138:
enewable energies. 4 The 2010 Energ
- Page 139 and 140:
Table 2 Micro hydropower sites in G
- Page 141 and 142:
1.5.6 Liberia Lara Esser, Internati
- Page 143 and 144:
1.5.7 Mali Oumar Sidibe, Direction
- Page 145 and 146:
1.5.8 Nigeria Basheer Adekunle Kade
- Page 147 and 148:
3. World Bank (2011). Economic over
- Page 149 and 150:
The only small hydropower station i
- Page 151 and 152:
1.5.10 Togo Lara Esser, Internation
- Page 153 and 154:
2 Americas 2.1 Caribbean Sven Homsc
- Page 155 and 156:
potential for small hydropower prov
- Page 157 and 158:
2.1.2 Dominica Sven Homscheidt, Car
- Page 159 and 160:
2.1.3 Dominican Republic Lara Esser
- Page 161 and 162:
2.1.4 Grenada Sven Homscheidt, Cari
- Page 163 and 164:
2.1.6 Haiti Lara Esser, Internation
- Page 165 and 166:
Immediate key initiatives for the f
- Page 167 and 168:
kW but less than 15 MW are consider
- Page 169 and 170:
Cibuco-Guajataca Culebrinas- Guanaj
- Page 171 and 172:
2.1.9 Saint Lucia Sven Homscheidt,
- Page 173 and 174:
Renewable energy policy In February
- Page 175 and 176:
Table 2 Classification of small hyd
- Page 177 and 178:
2. Bloomberg New Energy Finance and
- Page 179 and 180:
sector and rural communities will b
- Page 181 and 182:
1989 by the CEL and Universidad Cen
- Page 183 and 184:
years of commercial operation). In
- Page 185 and 186:
operate renewable energy projects a
- Page 187 and 188:
Since then, several values close to
- Page 189 and 190:
addition to long period of contract
- Page 191 and 192:
institutions portray a robust syste
- Page 193 and 194:
exemption from distribution and tra
- Page 195 and 196:
een lowered in this region. One of
- Page 197 and 198:
The upper limit of 15 MW is only a
- Page 199 and 200:
y Law 26190. It is not easy to meet
- Page 201 and 202:
provide not only labor, but local m
- Page 203 and 204:
2.3.3 Brazil Geraldo Lúcio Tiago F
- Page 205 and 206:
https://ben.epe.gov.br/downloads/Re
- Page 207 and 208:
Electrification with Renewable Ener
- Page 209 and 210:
2.3.5 Colombia Elena Quiroga Ferná
- Page 211 and 212:
grid/colombia/EnergyOverviewofColom
- Page 213 and 214:
The Constitution of Ecuador, approv
- Page 215 and 216:
2.3.7 French Guiana Laxmi Aggarwal
- Page 217 and 218:
2.3.8 Peru Lara Esser, Internationa
- Page 219 and 220:
In addition, Peru has a clean energ
- Page 221 and 222:
In accordance with the requirements
- Page 223 and 224:
Information on the total installed
- Page 225 and 226:
2.4.1 Canada Jinxing Huang, Canmet
- Page 227 and 228:
Table 4 Small hydropower potential
- Page 229 and 230:
2.4.2 United States of America Lara
- Page 231 and 232:
Table 2 Eligibility criteria for hy
- Page 233 and 234:
involving certain low-impact situat
- Page 235 and 236:
which hydropower plants under 30 MW
- Page 237 and 238:
share of total energy balance by 20
- Page 239 and 240:
2. World Meteorological Organizatio
- Page 241 and 242:
SHP installed capacity SHP potentia
- Page 243 and 244:
3.1.4 Turkmenistan Yingnan Zhang, I
- Page 245 and 246:
3.1.5 Republic of Uzbekistan Yingna
- Page 247 and 248:
Table 3 Small hydropower in Eastern
- Page 249 and 250:
In addition to the investment made
- Page 251 and 252:
3.2.2 Japan Motoyuki Inoue, Ritsume
- Page 253 and 254:
to release sediment from dams, it i
- Page 255 and 256:
infrastructure and of the transmiss
- Page 257 and 258:
3.2.5 Mongolia Dursan Basandorj, Mo
- Page 259 and 260:
3.3 Southern Asia Arun Kumar, India
- Page 261 and 262:
3.3.1 Afghanistan Lara Esser, Inter
- Page 263 and 264:
Livelihoods and Energy Department,
- Page 265 and 266:
3.3.2 Bangladesh Md. Abdul Wazed, C
- Page 267 and 268:
Hydropower projects, until recently
- Page 269 and 270:
Renewable energy policy The Renewab
- Page 271 and 272:
Table 2 Small hydropower in India P
- Page 273 and 274:
www.cia.gov/library/publications/th
- Page 275 and 276:
Procurement and Construction (EPC)
- Page 277 and 278:
3.3.6 Nepal Madhu Prasad Bhetuwal,
- Page 279 and 280:
Besides, EA and ER, there are Envir
- Page 281 and 282:
Table 2 Installed micro hydro plant
- Page 283 and 284:
3.3.8 Sri Lanka Nimashi Fernando, H
- Page 285 and 286:
presented at Sri Lanka Wind Power W
- Page 287 and 288:
Indonesia (99 MW). Viet Nam (2,205
- Page 289 and 290:
3.4.1 Cambodia Lara Esser, Internat
- Page 291 and 292:
3.4.2 Indonesia Lara Esser, Interna
- Page 293 and 294:
3.4.3 Lao People’s Democratic Rep
- Page 295 and 296:
The International Finance Corporati
- Page 297 and 298:
5. To enhance awareness on the role
- Page 299 and 300:
sustainability in policy is expecte
- Page 301 and 302:
ecent policy shift by the National
- Page 303 and 304:
2. Generate off-grid hydropower at
- Page 305 and 306:
3.4.8 Timor-Leste Lara Esser and Ka
- Page 307 and 308:
Sustainable Development On the Run
- Page 309 and 310:
comparison with other energy source
- Page 311 and 312:
Cyprus has an isolated energy syste
- Page 313 and 314:
3.2.1 Armenia Vahan Sargsyan, Levon
- Page 315 and 316:
3.5.2 Azerbaijan Ugranath Chakarvar
- Page 317 and 318:
3.5.3 Georgia Lara Esser and Kai Wh
- Page 319 and 320:
Regional Reports on Renewable Energ
- Page 321 and 322:
The Ministry of Water Resources is
- Page 323 and 324:
Table 1 Small hydropower potential
- Page 325 and 326:
3.5.6 Lebanon Joy Balta, Lebanese A
- Page 327 and 328:
13. Lebanon, Ministry of Power and
- Page 329 and 330:
Small hydropower potential in Turke
- Page 331 and 332:
4 Europe 4.1 Eastern Europe Lara Es
- Page 333 and 334:
2. The Russian Federation, Ministry
- Page 335 and 336:
Barriers to small hydropower develo
- Page 337 and 338:
Barriers to small hydropower develo
- Page 339 and 340:
parameters are taken into account.
- Page 341 and 342:
The development of hydropower plant
- Page 343 and 344:
2. European Small Hydropower Associ
- Page 345 and 346:
Renewable energy policy According t
- Page 347 and 348:
4.1.7 Romania European Small Hydrop
- Page 349 and 350:
4.1.8 Russian Federation Pascal Hau
- Page 351 and 352:
11. Russian Federation, Ministry of
- Page 353 and 354:
Renewable energy policy Slovakia ha
- Page 355 and 356:
References 1. Central Intelligence
- Page 357 and 358:
Regional overview and potential All
- Page 359 and 360:
4.2.1 Denmark European Small Hydrop
- Page 361 and 362:
4.2.2 Estonia European Small Hydrop
- Page 363 and 364:
4.2.3 Finland European Small Hydrop
- Page 365 and 366:
4.2.4 Iceland Lara Esser, Internati
- Page 367 and 368:
4.2.5 Ireland Lara Esser, Internati
- Page 369 and 370:
5.2.6 Latvia European Small Hydropo
- Page 371 and 372:
4.2.7 Lithuania European Small Hydr
- Page 373 and 374:
4.2.8 Norway Pascal Hauser, Interna
- Page 375 and 376:
4.2.9 Sweden European Small Hydropo
- Page 377 and 378:
4.2.10 United Kingdom of Great Brit
- Page 379 and 380:
Despite the issues which adversely
- Page 381 and 382:
characteristic has provided the Gov
- Page 383 and 384:
No. 9072 (last amended in November
- Page 385 and 386:
7. Energy Community (2008). Impleme
- Page 387 and 388:
Renewable energy policy Using renew
- Page 389 and 390:
development of small water currents
- Page 391 and 392:
changes should be scheduled and tim
- Page 393 and 394:
Legislation on small hydropower The
- Page 395 and 396:
development and construction of sma
- Page 397 and 398:
Licensing procedure suitable for sm
- Page 399 and 400:
Renewable energy policy Serbia has
- Page 401 and 402:
€93 (< 1,000 kW) €82 (< 10,000
- Page 403 and 404:
growing difficulty to obtain the ne
- Page 405 and 406:
Table 3 Small hydropower up to 10 M
- Page 407 and 408:
Barriers to small hydropower develo
- Page 409 and 410:
The Stream Map Project recommends t
- Page 411 and 412:
action. It will be also a good tool
- Page 413 and 414:
4.4.4 Germany European Small Hydrop
- Page 415 and 416:
4.4.5 Luxembourg European Small Hyd
- Page 417 and 418:
4.4.6 The Netherlands European Smal
- Page 419 and 420:
4.4.7 Switzerland Martin Bölli, Sk
- Page 421 and 422:
Available from www.meteoswiss.admin
- Page 423 and 424:
For New Zealand, the remaining pote
- Page 425 and 426:
Table 1 Small-scale hydropower deve
- Page 427 and 428:
5.2.2 New Zealand Niels Nielsen, In
- Page 429 and 430:
5.2 Pacific Island Countries and Te
- Page 431 and 432:
The Government of Fiji developed a
- Page 433 and 434:
Melanesia 5.2.1 Fiji Lara Esser, In
- Page 435 and 436:
5.2.2 New Caledonia Lara Esser, Int
- Page 437 and 438:
5.2.3 Papua New Guinea Lara Esser,
- Page 439 and 440:
5.2.3 Solomon Islands i Peter D. Ly
- Page 441 and 442:
organizations and foreign governmen
- Page 443 and 444:
Vanuatu Government anticipated fina
- Page 445 and 446:
In 1988, the Nanpil river hydropowe
- Page 447 and 448:
Polynesia 5.2.7 French Polynesia La
- Page 449 and 450:
5.2.8 Samoa Rapa Young, Electric Po
- Page 451 and 452:
List of tables Eastern Africa 14 1
- Page 453 and 454:
South America 178 1 Overview of cou
- Page 455 and 456:
Lebanon 310 1 Installed small hydro
- Page 457 and 458:
67 2 Small hydropower capacities in
- Page 459 and 460:
155 2 Small hydropower capacities i
- Page 461 and 462:
254 1 Electricity generation in Ind
- Page 463 and 464:
347 2 Small hydropower capacities i
- Page 465 and 466:
431 1 Electricity generation in Fre