

WSHPDR_2013_Final_Report-updated_version
WSHPDR_2013_Final_Report-updated_version
WSHPDR_2013_Final_Report-updated_version

Create successful ePaper yourself
Turn your PDF publications into a flip-book with our unique Google optimized e-Paper software.
5.1.1 Australia<br />
Niels Nielsen, International Energy Agency<br />
Hydropower Implementing Agreement<br />
Key facts<br />
Population 22,015,576 1<br />
Area 7,741,220 km 2<br />
Climate Generally arid to semi-arid; temperate<br />
in south and east; tropical in north. 1<br />
Topography Mostly low plateau with deserts; fertile<br />
plain in southeast; 1 A wide variety of<br />
landscapes, with subtropical rain<br />
forests in the north-east, mountain<br />
ranges in the south-east, south-west<br />
and east areas, and a dry desert in its<br />
centre<br />
Rain<br />
pattern<br />
Average annual rainfall below 600 mm<br />
over 80% of the country and below 300<br />
mm over 50% 2<br />
Electricity sector overview<br />
Australia’s primary electricity generation source is<br />
thermal (especially coal), with hydropower providing<br />
the largest renewable component (figure 1). The<br />
installed electricity generation capacity is around 56<br />
GW. The National Electricity Market (NEM) is the<br />
wholesale electricity market and the associated<br />
synchronous electricity transmission grid, serving five<br />
interconnected regions since 1998. These are<br />
Queensland, New South Wales, Tasmania, Victoria<br />
and South Australia. Tasmania, with predominantly<br />
hydropower generation, joined in 2006 when the<br />
undersea Basslink interconnector was fully<br />
commissioned.<br />
Wind<br />
Hydro<br />
Gas<br />
Coal<br />
3%<br />
8%<br />
12%<br />
0% 10% 20% 30% 40% 50% 60% 70% 80%<br />
Figure 1 Electricity generation in Australia<br />
Source: Australian Energy Regulator 3<br />
Note: Data from 2012.<br />
Total annual hydropower output in Australia is<br />
reduced during periods of prolonged drought.<br />
Tasmania accounts for about 30 per cent (2,250 MW)<br />
of the installed hydropower generating capacity in<br />
Australia, and New South Wales accounts for over half<br />
(4,180 MW). The Snowy hydropower scheme, which<br />
has a capacity of 3,800 MW, accounts for around half<br />
of Australia’s total hydropower generation capacity,<br />
but a considerably smaller proportion of energy<br />
generation. Queensland (640 MW) and Victoria (530<br />
MW) contribute to most of the remainder, with very<br />
78%<br />
limited development in Western Australia and South<br />
Australia. 4<br />
Many of Australia’s hydropower stations are over 40<br />
years old and have either been refurbished or are in<br />
need of refurbishment to ensure their ongoing<br />
reliability and availability. Replacement of these aging<br />
assets requires significant capital investment. Loss of<br />
these generators will make the challenge to increase<br />
overall renewable energy generation in Australia even<br />
harder. 4 The commercial decision to invest in these<br />
aging assets must be balanced with the level of<br />
certainty of an ongoing financial return. Renewable<br />
Energy Certificates (RECs) will remain critical in<br />
providing incentives to upgrade and redevelop aging<br />
hydropower plants and ongoing changes to incentive<br />
policies must be positive to maintain investor<br />
confidence and business case for such investments.<br />
It is predicted that while the installed hydropower<br />
capacity will continue to grow, the total contribution<br />
of hydropower as a proportion of Australia’s overall<br />
electricity mix will decrease due to underlying growth<br />
in other energy sources such as gas, wind and solar. 5<br />
Small hydropower sector overview and potential<br />
The oldest operating small hydropower plant in<br />
Australia, Mooring in Tasmania (three units, with each<br />
at 0.2 MW), was commissioned in 1907. Five other<br />
small hydropower plants that are still operating were<br />
built between 1926 and 1928. In the 1950s and the<br />
1960s, four additional small hydropower plants were<br />
built. Only one hydropower plant, which was built in<br />
1960, has been re-commissioned (1983). No<br />
additional information is available on refurbishments<br />
of this batch of very old small hydropower plants.<br />
Between 1983 and 2010, over 50 small hydropower<br />
plants were built, all of which are currently operating.<br />
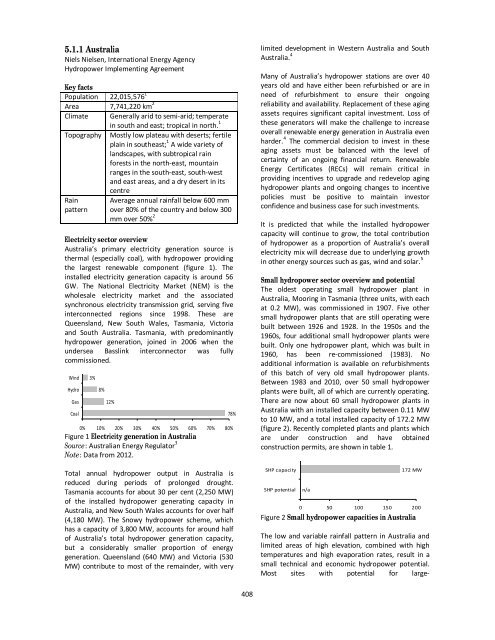
There are now about 60 small hydropower plants in<br />
Australia with an installed capacity between 0.11 MW<br />
to 10 MW, and a total installed capacity of 172.2 MW<br />
(figure 2). Recently completed plants and plants which<br />
are under construction and have obtained<br />
construction permits, are shown in table 1.<br />
SHP capacity<br />
SHP potential<br />
n/a<br />
172 MW<br />
0 50 100 150 200<br />
Figure 2 Small hydropower capacities in Australia<br />
The low and variable rainfall pattern in Australia and<br />
limited areas of high elevation, combined with high<br />
temperatures and high evaporation rates, result in a<br />
small technical and economic hydropower potential.<br />
Most sites with potential for large-<br />
408