

WSHPDR_2013_Final_Report-updated_version
WSHPDR_2013_Final_Report-updated_version
WSHPDR_2013_Final_Report-updated_version

Create successful ePaper yourself
Turn your PDF publications into a flip-book with our unique Google optimized e-Paper software.
4.3.11 Spain<br />
European Small Hydropower Association, Stream Map<br />
Key facts<br />
Population 47,042,984<br />
Area 505,370 km 2 . 1<br />
Climate Temperate; clear, hot summers in<br />
interior, more moderate and cloudy<br />
along coast; cloudy, cold winters in<br />
interior, partly cloudy and cool along<br />
coast<br />
Topography Large, flat to dissected plateau<br />
surrounded by rugged hills; Pyrenees<br />
Rain<br />
pattern<br />
Electricity sector overview<br />
The total net electricity production in Spain was 280<br />
TWh in 2011, of which approximately 6 TWh was<br />
exported and 3 TWh was used for pumped hydro. The<br />
domestic demand was about 270 TWh. 2 The electricity<br />
mix is shown in figure 1.<br />
Bio<br />
Fuel/Gas<br />
Solar<br />
Other<br />
Hydro<br />
Wind<br />
Coal<br />
CCGT<br />
Nuclear<br />
2%<br />
3%<br />
3%<br />
11%<br />
11%<br />
15%<br />
16%<br />
19%<br />
0% 5% 10% 15% 20%<br />
Figure 1 Electricity generation in Spain<br />
Source: Red Electrica de Espana 2<br />
20%<br />
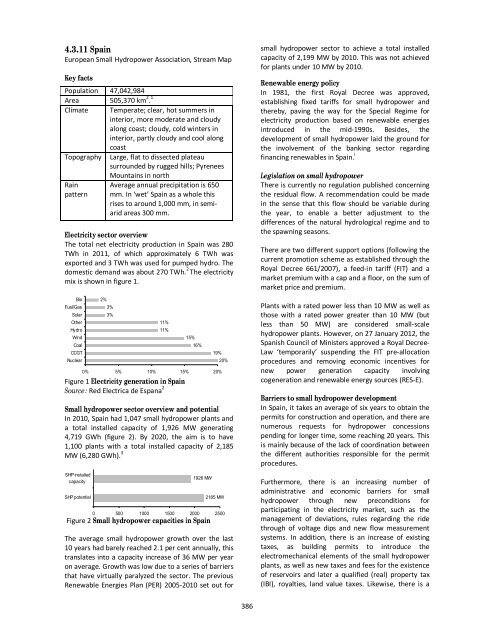
Small hydropower sector overview and potential<br />
In 2010, Spain had 1,047 small hydropower plants and<br />
a total installed capacity of 1,926 MW generating<br />
4,719 GWh (figure 2). By 2020, the aim is to have<br />
1,100 plants with a total installed capacity of 2,185<br />
MW (6,280 GWh). 3<br />
SHP installed<br />
capacity<br />
SHP potential<br />
Mountains in north<br />
Average annual precipitation is 650<br />
mm. In ‘wet’ Spain as a whole this<br />
rises to around 1,000 mm, in semiarid<br />
areas 300 mm.<br />
1926 MW<br />
2185 MW<br />
0 500 1000 1500 2000 2500<br />
Figure 2 Small hydropower capacities in Spain<br />
The average small hydropower growth over the last<br />
10 years had barely reached 2.1 per cent annually, this<br />
translates into a capacity increase of 36 MW per year<br />
on average. Growth was low due to a series of barriers<br />
that have virtually paralyzed the sector. The previous<br />
Renewable Energies Plan (PER) 2005-2010 set out for<br />
small hydropower sector to achieve a total installed<br />
capacity of 2,199 MW by 2010. This was not achieved<br />
for plants under 10 MW by 2010.<br />
Renewable energy policy<br />
In 1981, the first Royal Decree was approved,<br />
establishing fixed tariffs for small hydropower and<br />
thereby, paving the way for the Special Regime for<br />
electricity production based on renewable energies<br />
introduced in the mid-1990s. Besides, the<br />
development of small hydropower laid the ground for<br />
the involvement of the banking sector regarding<br />
financing renewables in Spain. i<br />
Legislation on small hydropower<br />
There is currently no regulation published concerning<br />
the residual flow. A recommendation could be made<br />
in the sense that this flow should be variable during<br />
the year, to enable a better adjustment to the<br />
differences of the natural hydrological regime and to<br />
the spawning seasons.<br />
There are two different support options (following the<br />
current promotion scheme as established through the<br />
Royal Decree 661/2007), a feed-in tariff (FIT) and a<br />
market premium with a cap and a floor, on the sum of<br />
market price and premium.<br />
Plants with a rated power less than 10 MW as well as<br />
those with a rated power greater than 10 MW (but<br />
less than 50 MW) are considered small-scale<br />
hydropower plants. However, on 27 January 2012, the<br />
Spanish Council of Ministers approved a Royal Decree-<br />
Law ‘temporarily’ suspending the FIT pre-allocation<br />
procedures and removing economic incentives for<br />
new power generation capacity involving<br />
cogeneration and renewable energy sources (RES-E).<br />
Barriers to small hydropower development<br />
In Spain, it takes an average of six years to obtain the<br />
permits for construction and operation, and there are<br />
numerous requests for hydropower concessions<br />
pending for longer time, some reaching 20 years. This<br />
is mainly because of the lack of coordination between<br />
the different authorities responsible for the permit<br />
procedures.<br />
Furthermore, there is an increasing number of<br />
administrative and economic barriers for small<br />
hydropower through new preconditions for<br />
participating in the electricity market, such as the<br />
management of deviations, rules regarding the ride<br />
through of voltage dips and new flow measurement<br />
systems. In addition, there is an increase of existing<br />
taxes, as building permits to introduce the<br />
electromechanical elements of the small hydropower<br />
plants, as well as new taxes and fees for the existence<br />
of reservoirs and later a qualified (real) property tax<br />
(IBI), royalties, land value taxes. Likewise, there is a<br />
386